Researcher
Engineered to filter market noise
Our Active Quant strategy is designed to be highly effective by analyzing vast amounts of potential opportunities and exploiting market inefficiencies resulting from predictable patterns.


Intangible investment has long exceeded tangible capital allocation among mega-cap firms, but the AI-driven surge in capital expenditure is signaling a renaissance of physical investment. This raises important questions for investors about overinvestment risks, reinforced competitive moats, and how to balance these forces in active strategies.


For decades, equity markets have been shaped by the rise of the intangible economy. Capital allocation shifted from physical assets (factories, machinery, industrial equipment) toward non-physical assets (software, data, intellectual property), enabling scalability, network effects, and winner-takes-most dynamics. Intangible investment overtook tangible spending in advanced economies in the late 1990s, and today non-physical assets account for the majority of corporate value in major indices. This shift underpins market concentration, elevated valuations, and the dominance of digital platform firms. 1

Our Active Quant strategy is designed to be highly effective by analyzing vast amounts of potential opportunities and exploiting market inefficiencies resulting from predictable patterns.
However, the release of ChatGPT and the subsequent rise of generative AI appear to be reshaping this pattern. Figure 1 compares capital expenditure (capex) of the Magnificent Seven stocks (stacked bars) with their aggregated research and development (R&D) expenditures (grey area). For most of the sample period, R&D exceeded capex, which is consistent with asset-light business models. But since 2023, capex has been accelerating sharply, as firms expanded data centers, computing capacity, and supporting infrastructure to scale AI. As a result, capex has surpassed R&D in mid-2024.
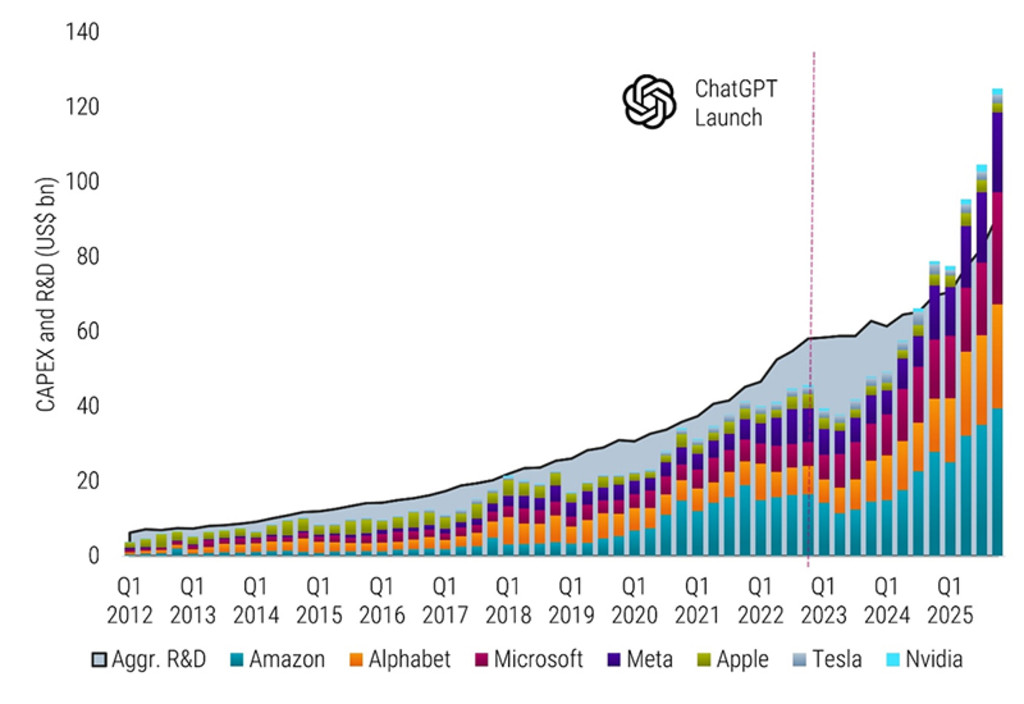
The companies shown here are for illustrative purposes only. No inference can be made on the future development of the company. This is not a buy, sell, or hold recommendation. Source: Robeco, LSEG, Compustat. The figure displays quarterly capital expenditure (capex) of the Magnificent Seven stocks (stacked bars) alongside their aggregated research and development (R&D) expenditures (grey area). The Magnificent Seven comprise Alphabet, Amazon, Apple, Meta Platforms, Microsoft, Nvidia, and Tesla. The sample period spans Q1 2012 to Q4 2025. Company fiscal quarters are mapped to corresponding calendar quarters to ensure comparability, as fiscal year-ends differ across firms. For illustrative purposes only.
Rather than marking the end of the intangible economy, this shift likely reflects its industrialization. Producing AI models and data-driven applications increasingly requires large-scale physical investment, shifting the balance of capital deployment for the foreseeable future. In this sense, the current trend represents a renaissance of tangible capital within an intangible economy.
Subscribe for cutting-edge quant strategies and insights.
What does the AI capex boom imply for stock selection? First, elevated capex today translates into higher depreciation expenses in the future. Physical investments are capitalized on the balance sheet and depreciated over time through the income statement. Uncertainty surrounding the useful lives of rapidly evolving technologies such as AI hardware therefore complicates earnings forecasts, as small changes in lifetime assumptions can materially affect reported earnings trajectories. 2
Second, historical evidence suggests caution when firms aggressively expand their capital base. The well-documented investment effect indicates that companies undertaking rapid asset expansion tend to underperform peers over subsequent periods, reflecting competitive overinvestment and capacity buildouts that compress returns. 3
However, large-scale infrastructure investment may also strengthen the competitive moats of already dominant firms by reinforcing scale advantages, deepening ecosystem integration, and raising barriers to entry. Firms able to finance and deploy such investment effectively may consolidate strategic leadership. The AI capex boom therefore has the potential to entrench even further their market position through the build-out of data-center infrastructure.
This tension between potential overinvestment and moat reinforcement is particularly relevant in today’s highly concentrated equity markets. With a combined weight in the MSCI World approaching 25%, the Magnificent Seven exert substantial influence on benchmark outcomes.
Alpha generation in active strategies, however, need not be equally dependent on this small group. One way to address this challenge is through a systematic, benchmark-aware approach that emphasizes breadth across the global equity universe, such as the Robeco Global Developed Active Equities strategy. Rather than taking large directional positions in a small number of mega-cap stocks, it distributes active risk across hundreds of positions guided by a quantitative stock-selection model and disciplined risk management. In doing so, the strategy seeks to navigate the industrialization of the intangible economy and the uncertainty introduced by rising capital intensity in a balanced and resilient manner.
1 See also ‘The rise of America’s intangible economy’, Financial Times, August 2025.
2 See also ‘Big tech’s $680bn buy-now-book-later problem’, Financial Times, January 2026.
3 See also ‘Surviving the AI Capex Boom’, Sparkline Capital, October 2025.
The contents of this document have not been reviewed by the Securities and Futures Commission ("SFC") in Hong Kong. If you are in any doubt about any of the contents of this document, you should obtain independent professional advice. This document has been distributed by Robeco Hong Kong Limited (‘Robeco’). Robeco is regulated by the SFC in Hong Kong. This document has been prepared on a confidential basis solely for the recipient and is for information purposes only. Any reproduction or distribution of this documentation, in whole or in part, or the disclosure of its contents, without the prior written consent of Robeco, is prohibited. By accepting this documentation, the recipient agrees to the foregoing This document is intended to provide the reader with information on Robeco’s specific capabilities, but does not constitute a recommendation to buy or sell certain securities or investment products. Investment decisions should only be based on the relevant prospectus and on thorough financial, fiscal and legal advice. Please refer to the relevant offering documents for details including the risk factors before making any investment decisions. The contents of this document are based upon sources of information believed to be reliable. This document is not intended for distribution to or use by any person or entity in any jurisdiction or country where such distribution or use would be contrary to local law or regulation. Investment Involves risks. Historical returns are provided for illustrative purposes only and do not necessarily reflect Robeco’s expectations for the future. The value of your investments may fluctuate. Past performance is no indication of current or future performance.