Researcher
Active Quant: finding alpha with confidence
Blending data-driven insights, risk control and quant expertise to pursue reliable returns.


Emerging markets have proven to be fruitful for well-established equity factors. Moreover, our research shows that these generic equity factors can be substantially enhanced for emerging markets.


Emerging markets account for around 58% of global GDP and this is forecasted to rise to 61% by 2026.1 Furthermore, more than 70% of the world’s population lives in these countries. However, emerging markets only represent about 12% of the MSCI All Country Index.
That said, the outlook for emerging markets has improved. As a group, emerging market stocks are cheaper than their developed market peers, partly due to the former lagging the latter in terms of performance over the last ten years. Thus on valuation grounds, they present an attractive prospect for global investors. Furthermore, our research shows there is a strategic case for allocating to emerging markets on an overall portfolio level.2
The macroeconomic backdrop could also provide support for emerging markets, given the group has a substantial current account surplus and is less troubled by inflation. Moreover, some individual countries even have room for fiscal and monetary stimulus.3 And while sustainable investing in emerging markets is considered challenging, our recent study illustrates that sustainable emerging market companies are actually as ‘green’ as those in developed markets.4

Blending data-driven insights, risk control and quant expertise to pursue reliable returns.
Historically, well-established factors have delivered solid performance in emerging markets. This is depicted in Figure 1 which highlights the annualized Sharpe ratios of both generic and enhanced value, quality, momentum and multi-factor (25% value, 25% quality, and 50% momentum) portfolios.
While generic value (book to market), quality (return on equity) and momentum (price momentum) factors exhibit positive Sharpe ratios ranging roughly between 0.1 and 0.6, their multi-factor combination achieves a Sharpe ratio of 0.8 due to diversification benefits.
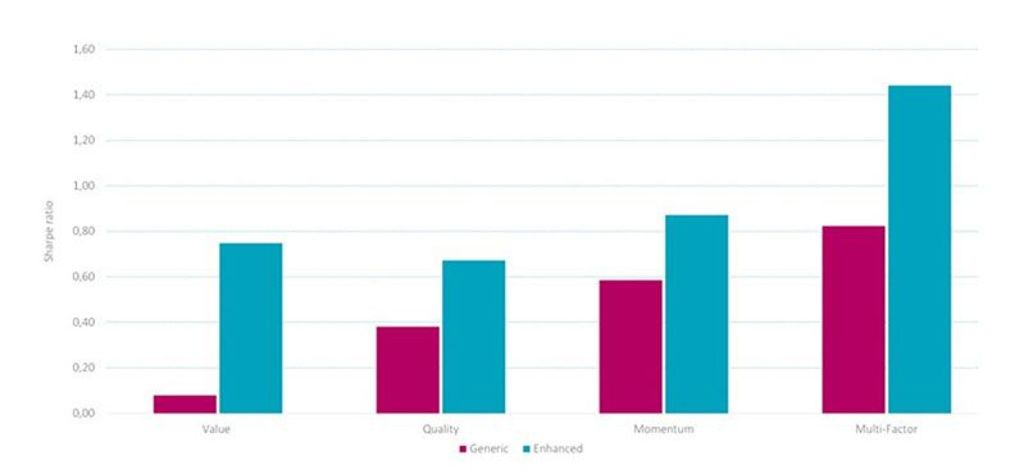
Source: Refinitiv, Robeco. The figure shows the annualized Sharpe ratio of generic versus enhanced value, quality, momentum and multi-factor (25% value, 25% quality, and 50% momentum) composite factors. Factor returns are the return spreads between the top and bottom factor quintile portfolios. Portfolios are equal-weighted, rebalanced monthly and the holding period is six months. The investment universe consists of the non-financial constituents of the MSCI Emerging Markets Index. Before 2001, we use the largest 800 constituents of the S&P Emerging BMI at the semi-annual index rebalance going back to December 1995. The sample period is January 1996 to July 2022.
Our research demonstrates that these generic definitions can be substantially enhanced.5 For instance, the enhanced value composite6 that considers a broader range of fundamentals, such as earnings, cashflows, payouts, and intangible-adjusted book value, boosts the Sharpe ratio to nearly 0.8.
Similarly, a composite of quality metrics that has been shown to predict future growth in profitability (gross profitability, accruals, and investments)7 nearly doubles the Sharpe ratio compared to backward-looking return on equity.
While generic price momentum offers an attractive Sharpe ratio of almost 0.6, price momentum returns are also highly negatively skewed, exposing them to large drawdowns from time to time. Our research shows that a momentum composite that also considers residual8 and earnings momentum (price momentum, residual price momentum and analysts’ earnings revisions) exhibits a higher premium and significantly moderates these momentum crashes.
Finally, the enhancements of the individual factors also translate to the multi-factor level (again 25% value, 25% quality, and 50% momentum) as the Sharpe ratio for the multi-factor combination increases from 0.8 to about 1.4.

1IMF, April 2022, “World economic outlook database”, IMF.
2De Groot, W., and Zhou, W., October 2018, “Strategic allocation to emerging markets factor premiums”, Robeco white paper.
3Van Rijn, A., June 2022, “Anyone for hiking this summer?”, Robeco article.
4De Groot, W., and Sulman, V., June 2022, “Marrying sustainability and emerging markets expertise in quantitative strategies”, Robeco article.
5Robeco has published numerous papers on emerging markets over the last two decades. See for example: van der Hart, J., Slagter, E., and van Dijk, D., 2003, “Stock selection strategies in emerging markets”, Journal of Empirical Finance; van der Hart, J., de Zwart, G., and van Dijk, D., 2005, “The success of stock selection strategies in emerging markets: Is it risk or behavioral bias?”, Emerging Markets Review; Blitz, D., Pang, J., and van Vliet, P., 2013, “The volatility effect in emerging markets”, Emerging Markets Review; Hanauer, M. X., and Lauterbach, J. G., 2019, “The cross-section of emerging market stock returns”, Emerging Markets Review.
6Blitz, D., and Hanauer, M. X., January 2021, “Resurrecting the value premium”, Journal of Portfolio Management.
7Kyosev, G., Hanauer, M. X., Huij, J., and Lansdorp, S., May 2020, “Does earnings growth drive the quality premium”, Journal of Banking and Finance.
8Lansdorp, S., October 2013, “Robeco’s residual momentum: less risky and more sustainable”, Robeco article.
Subscribe for cutting-edge quant strategies and insights.