Chief Researcher

• 5-Year outlook
Factor investing – going beyond Fama and French
There is more to factor investing than the standard academic factors, says Head of Quant Research David Blitz.
Summary
- 2010-2019 was a lost decade for the Fama-French factors
- Alternative factors did deliver over the same period
- Some factors such as low-risk even had a great decade
The period 2010 to 2019 was a lost decade for the factors in Professors Eugene Fama and Kenneth French’s widely used five-factor model. Over this period, the equity factors – value, size, profitability and investment – delivered a negative return on average, while the return on each individual factor was well below its long-term average. Nevertheless, dismissing factor investing altogether based solely on these results would be short-sighted.
The dismal performance between 2010 and 2019 is not unprecedented. New research by Robeco shows that the returns in this period were actually remarkably similar to those generated between 1990 and 1999. Yet this did not prevent them from making a strong comeback in the following decade. Moreover, we find that many time-tested alternative equity factors which are not considered in the Fama-French model did generate positive performance between 2010 and 2019.
The performance of the Fama-French factors before and after 2010 can be seen in the chart below. In the most recent decade (2010-2019), the return on each of these factors was well below its long-term average. Size and value even experienced a negative decade, with the latter performing so poorly that it prompted a series of empirical studies into whether the value premium might have disappeared for good.
Figure 1: Performance of the Fama-French factors
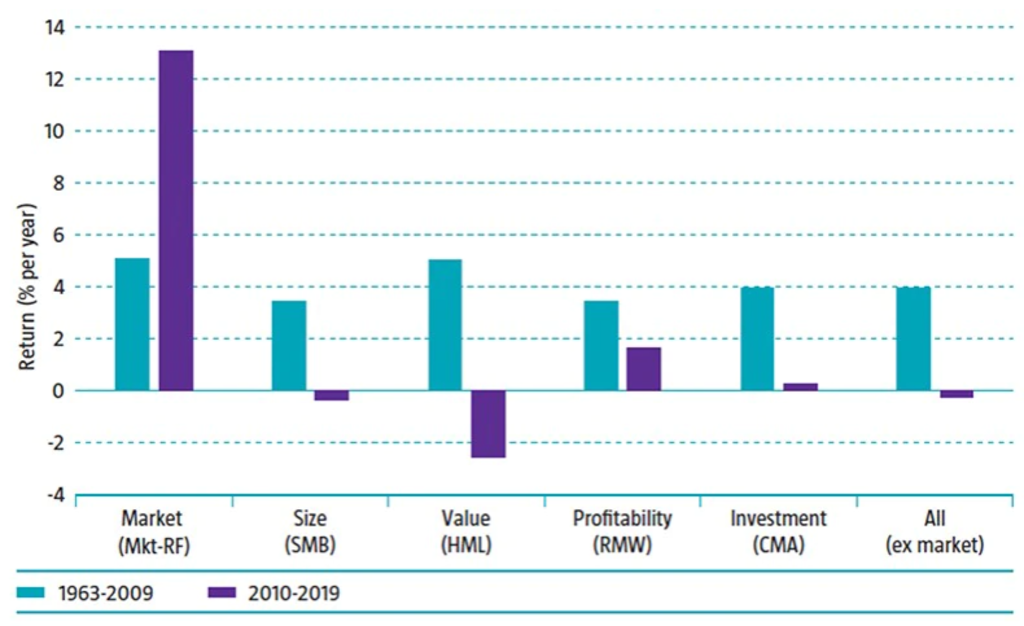

Source: Robeco, Kenneth French Data Library. Sample period: July 1963 to December 2019.
Size and value weren’t the only factors to have a rough ride. Over the past decade, the premium on the investment factor also failed to materialize, with a return close to zero. Only the profitability factor generated a positive return, but this premium was only around half the size it had been before 2010.
The weak performance of these two newly added factors is particularly striking, since they were introduced in Fama and French’s 2015 study, which used data until the end of 2013. In other words, part (40%) of the most recent – disappointing – decade was taken into account in the study that proposed the two new factors.

Other factors in French’s data library
However, these are not the only factors out there. The data library maintained by Kenneth French also tracks the performance of various factors that are not considered in the five-factor model. These include three alternative value metrics of earnings-to-price, cash-flow-to-price and dividend yield.
Then there is 12-to-one-month price momentum; short-term reversal; using net share issuance as an alternative investment factor; and the change in operating working capital to book value (accruals). Finally, there are three low-risk factors: 60-month market beta, 60-day variance and 60-day residual variance. The performance of these factors is shown in the chart below.
Figure 2: Performance of the other factors in Kenneth French’s data library
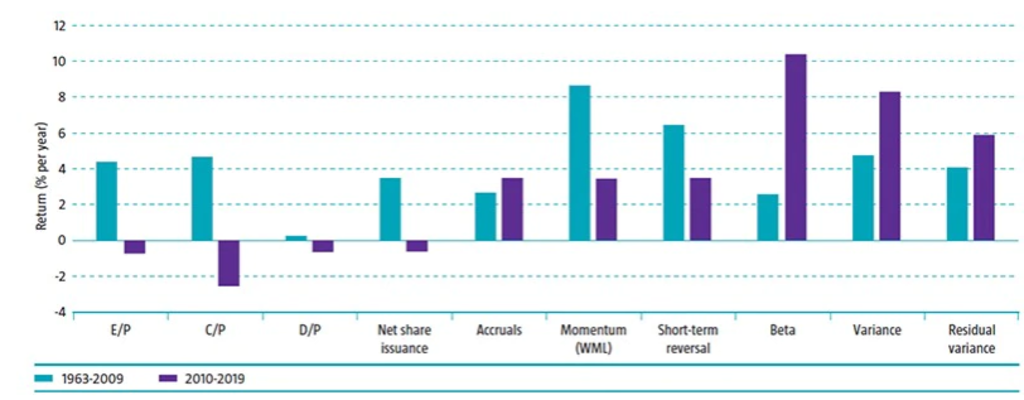
Source: Robeco, Kenneth French Data Library. Sample period: July 1963 to December 2019.
The three alternative value metrics all had a negative return over the last decade, similar to Fama and French’s conventional value factor of high-minus-low (HML). The alternative investment factor, net share issuance, also ended up in negative territory.
With a return of 3.5% for the period from 2010 to 2019, the accruals factor fared better and even generated a slightly higher return than in the preceding period. This is consistent with a study carried out in 2016, also by Fama and French, which found that the five-factor model has difficulties explaining the performance of accruals portfolios. Results for the period from 2010 to 2019 confirm that the accruals factor can do well when the Fama-French factors struggle.
(Lack of) momentum
Turning to momentum, this is a factor that is often used to augment the Fama-French factor models; for example, by turning the five-factor model into a six-factor one. Momentum returned a shocking -82% in 2009, turning 2000 to 2009 into a lost decade for the factor.
However, for the period from 2010 to 2019, we observe an average premium of around 3.5% for momentum. Although below the long-term average, this is still well within positive territory. So, it seems premature to discard momentum altogether. Interestingly, the factor also saw its best decade between 1990 and 1999 – the other tough decade for Fama and French’s factors.
Meanwhile, the short-term reversal factor delivered a return of around 3.5% in the last decade, which, like for momentum, is below its long-term average, but well above zero. Most notable, however, are the three low-risk factors, which generated premiums of around 6 to 10% in the period from 2010 to 2019. This makes it the second-best decade ever for low risk, after 1980 to 1989.
The Hou-Xue-Zhang factors
Then there is the data library maintained by finance professors Kewei Hou, Chen Xue and Lu Zhang. It contains value-weighted decile portfolios for about 50 individual factors taken from their 2020 paper, ‘Replicating anomalies’. Since most of these factors were first documented well before 2010, the past decade enables us to test them outside the sample period that was originally used.
To that end, we combined closely related factors into composite factors by averaging their returns, which brings down the number of factors to 13. For instance, five separate seasonal factors were combined into one composite seasonal factor. The performance of these composite factors is shown in the chart below.
Figure 3: Performance of the factors in the Hou-Xue-Zhang data library
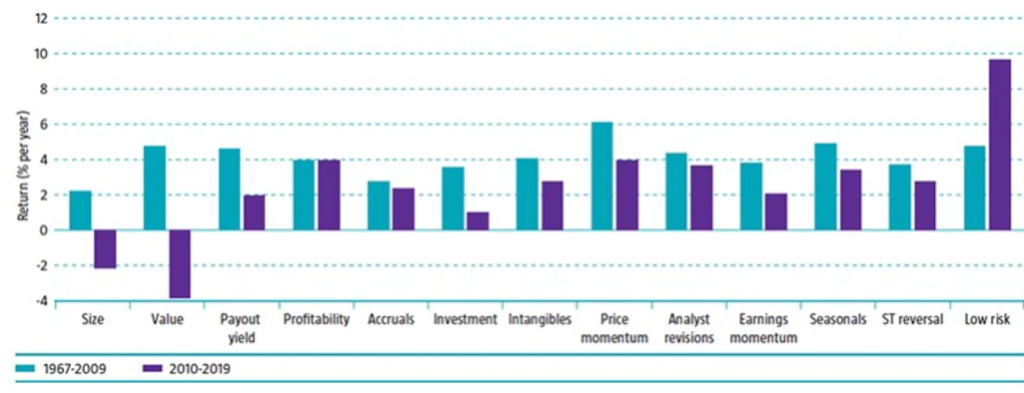
Source: Robeco, Hou-Xue-Zhang data library. Sample period: January 1967 to December 2019.
Consistent with the previous results, the composite size and value factors exhibit a negative premium for the most recent decade. Remarkably, however, the other 11 composite factors all exhibit positive returns for 2010 to 2019: payout yield, profitability, accruals, investment, intangibles, price momentum, analyst revisions, earnings momentum, seasonals, short-term reversal and low risk.
For profitability, price momentum, short-term reversal and low risk, these results confirm earlier findings for the Fama-French versions of these factors. The main takeaway is that while the Fama-French factors experienced a lost decade between 2010 and 2019, many alternative factors actually had a decent or, in some cases, even very good recent decade.
This article is an excerpt of a special topic in our five-year outlook.