Head of Conservative Equities and Chief Quant Strategist


• 市場觀點
Quant chart: Successfully reducing drawdowns
In investing, minimizing losses is crucial for long-term capital growth. This timeless truth is especially relevant today, with major stock market indices experiencing significant drawdowns. To illustrate this point, a 20% loss requires “only” a 25% gain to recover, while a 50% loss demands a staggering 100% rebound.
作者


Portfolio Manager



Researcher
The Robeco Conservative Equities strategy is designed to win by losing less during market downturns. Over its nearly 20-year live track record, the global equity market has endured ten distinct episodes of drawdowns exceeding 10%, as illustrated in Figure 1.
Figure 1 | Real-life drawdown reduction during ten distinct market drawdowns
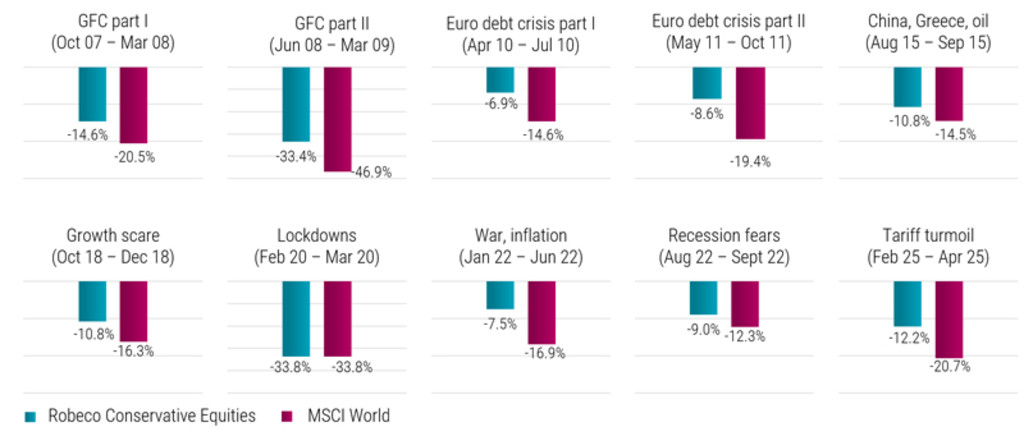
Past performance is no guarantee of future results. The value of your investment may fluctuate. Source: Robeco. The figure shows the maximum drawdowns of the Robeco Conservative Equities strategy versus the MSCI World Index during ten distinct market drawdown episodes since the start of the strategy in October 2006, as selected by Robeco. The length of the period is based on when MSCI World reached the pre-sell-off level (not yet reached again for the “tariff turmoil” scenario, for which the drawdowns are measured up to April 29, 2025). Drawdowns are measured based on daily data in EUR of the net asset value of the representative account Robeco QI Institutional Global Developed Conservative Equities strategy, gross-of-fees. In reality, costs such as management fees and other costs are charged. These have a negative effect on the returns shown.
Since then, the strategy has successfully navigated multiple periods of volatility, including the European debt crisis (2010/2011), the oil price shock (2015), and the growth scare of 2018, which, notably, was also linked to early tariff tensions under the Trump administration. These drawdown periods were followed by the first Covid-19 lockdown (2020), stagflation concerns (2022), and the ongoing tariff turmoil (2025). While the current episode is still evolving, recent uncertainty surrounding central bank independence has further unsettled investors.
Across all these ten market corrections — with the exception of the first pandemic lockdown — the Robeco Conservative Equities strategy delivered the expected downside protection. More specifically, while the MSCI World Index experienced an average drawdown of 21.6%, the Robeco strategy averaged just a 14.8% drawdown, reducing relative risk by more than 30%. The ability to limit loss highlights the strategy’s effectiveness in preserving capital and supporting long-term compounding.
Although the strategy may lag during strong bull markets, its consistent downside protection has contributed to better long-term results. From its inception in October 2006 through March 2025 (excluding April data), the strategy has delivered an annualized return of 8.3%, compared to 7.8% for the MSCI World Index, both in EUR. Importantly, it has done so with significantly lower volatility — offering equity investors a smoother, more reassuring ride.
重要資料
本網站僅供《證券及期貨條例》(香港法例第571章)及其附屬法例所界定之專業投資者瀏覽及使用。 投資涉及風險。過往表現並不代表未來表現。本網站所載資料僅供參考之用,並不構成任何投資建議,亦非作出買賣任何證券或採納任何投資策略之要約或招攬。投資者不應僅憑本網站提供之資料作出投資決定,在作出任何投資決定前,應徵詢獨立意見(包括有關稅務影響之意見)。投資者應確保完全理解投資產品的相關風險,亦應考量自身投資目標及風險承受水平。投資乃閣下之個人決定。除非銷售投資產品的中介人已向閣下告知該投資產品適合閣下,並已解釋其符合閣下投資目標之原因,否則閣下不應投資。請參閱相關發售文件或其他法律文件,以獲取包括風險因素在內的進一步詳情。 本網站由荷寶投資管理香港有限公司發布,該公司受香港證券及期貨事務監察委員會(「證監會」)規管(中央編號:APU851)。本網站未經證監會審閱。 無法保證任何投資產品可實現其投資目標。概不就任何投資產品之表現或投資回報作任何聲明或承諾。投資的價值或會波動。本網站所載過往表現、推算或預測,均不應視作未來表現之保證或指標,且概不提供任何明示或暗示之保證。本網站內容建基於相信為可靠之來源,惟因應資料傳遞技術特性及須採用多項數據來源(包括第三方內容),故概不保證其準確性。所述觀點僅乃截至上述日期,或會隨市況變化而改變,可予更改而毋須另行通知。該等意見可能有別於其他荷寶投資專業人士之意見。因使用本材料或當中所載任何評論、意見或估算而引致之直接、間接或相應損失,荷寶概不承擔法律責任。荷寶並無責任更新本網站或任何網站內容。未經荷寶事先書面許可,不得複製、分發或刊發本網站任何材料。 除非另有說明,資料來源:荷寶。