Chief Researcher



• 市場觀點
Do investors score with football stocks?
As anticipation builds for the new football season, we delve into the risk and return dynamics of football club stocks.
作者






Researcher

Researcher
概要
- Football club stocks are a rare example of both low beta and high volatility
- Their poor long-term performance is similar to risky stocks and unlike defensive stocks
- Football stocks are like lottery tickets and best left to speculators or die-hard fans
Although the majority of football clubs are privately held, enough are publicly listed to warrant in-depth exploration. These stocks might not be on every investor's radar, largely due to their low market capitalizations. This means their financial and economic impact is limited, which prevents their inclusion in mainstream stock indices.
However, their unique nature makes for an intriguing case study. For example, in October 2004, the stock price of Arsenal's "Invincibles" spiked by an impressive 67% after the team achieved an unbeaten streak of 49 games. Conversely, Juventus experienced a 45% drop in May 2006 following the revelation of the "Calciopoli scandal".1
Generally, a club's revenue is heavily tied to their on-field performance, where the line between success and failure is often razor-thin. Unlike conventional firms, football clubs tend to focus less on maximizing shareholder dividends, instead opting to reinvest earnings into their teams to enhance their potential for winning future matches and titles.
Our aim was to identify the most significant football stocks in terms of market capitalization, not only today, but also historically to avoid survivorship bias.2 Our sample consists of 26 football stocks from across a dozen European countries, typically competing in their respective local premier leagues. This includes well-known clubs such as Manchester United, Arsenal, Borussia Dortmund, Juventus, Olympique Lyon, and Ajax. A comprehensive overview of the included football stocks is given below in Figure 1.
Figure 1: Sample of listed European football clubs

Source: Robeco, STOXX. The figure visualizes our sample of listed European football clubs: Aalborg, AFC Ajax, Aarhus, AIK Fotboll, Arsenal, AS Roma, Benfica, Besiktas, Borussia Dortmund, Brondby IF, Celtic, FC Porto, Fenerbahçe S.K., FK Teteks, Galatasaray, Juventus, Kopenhagen FC, Lazio Roma, Manchester United, Newcastle United, Olympique Lyon, Ruch Chorzow, Silkeborg IF, Sporting Lisbon, Tottenham Hotspur, Trabzonspor.
Our sample spans from January 1997 to March 2023, offering over a quarter-century's worth of data. We gathered return and market cap data for each individual stock and constructed a football index by determining the capitalization-weighted average return of the available stocks at each point in time.
Initially, our football stock count is a mere 6, but the index gradually diversifies. Until 2005, the index is significantly influenced by Manchester United, with an average weight exceeding 40%. After Manchester United's delisting in 2005, the index becomes more balanced, a trend that persists even after Manchester United is relisted in 2012.
Low risk or high risk?
Our first analysis focuses on the risk associated with football stocks. The two most important risk measures are volatility and beta. For most stocks, these risk measures align closely, i.e., low-volatility stocks also tend to be low-beta stocks, and high-volatility stocks also tend to be high-beta stocks.
This relationship is illustrated in Figure 2, which classifies all MSCI Europe index constituents into three volatility buckets and three beta buckets independently.3 The graph demonstrates that most stocks fall along the diagonal from front left to rear right (blue bars), while stark differences between volatility and beta (red bars) tend to be quite rare.
Figure 2: Distribution of MSCI Europe constituents in volatility and beta groups
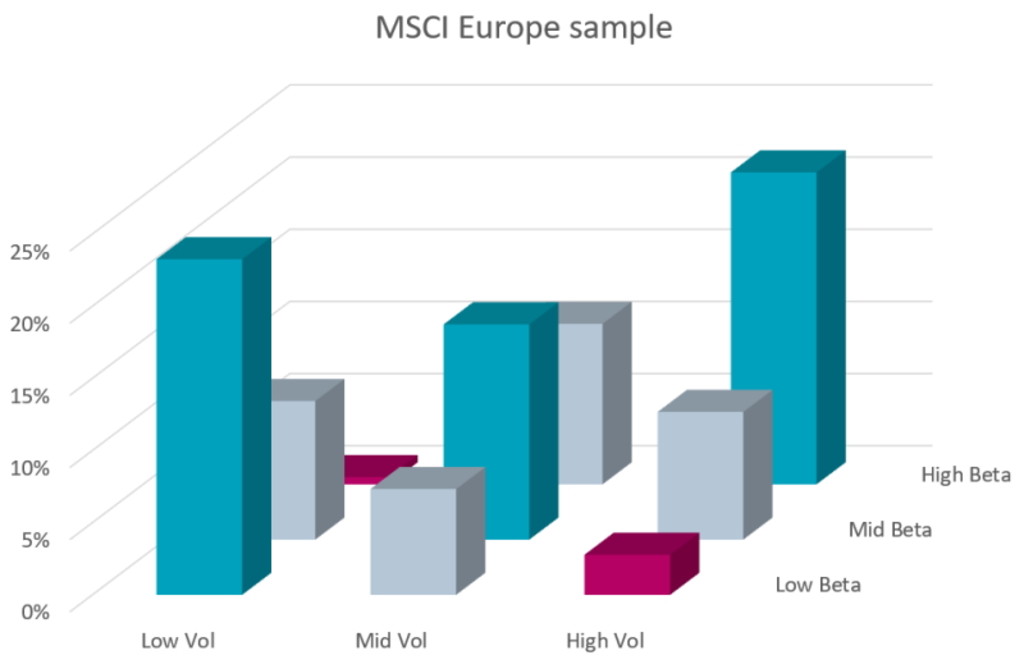
Source: Robeco, Refinitiv. The figure shows the distribution of MSCI Europe Index constituents in volatility and beta groups. To be included in the sample, we require at least five years of available return data. The sample period is January 1997 to March 2023.
However, football stocks exhibit very different risk characteristics. As shown in Figure 3, most football stocks simultaneously display a high volatility and a low beta, a very unusual combination. The high volatility means that share prices fluctuate widely, but the low beta indicates minimal co-movement with the market. In simple terms, the prices of football stocks go all over the place, but in their own unique way. Depending on the definition of risk, this makes them both low-risk and high-risk stocks at the same time.
Figure 3: Distribution of European football stocks in volatility and beta groups
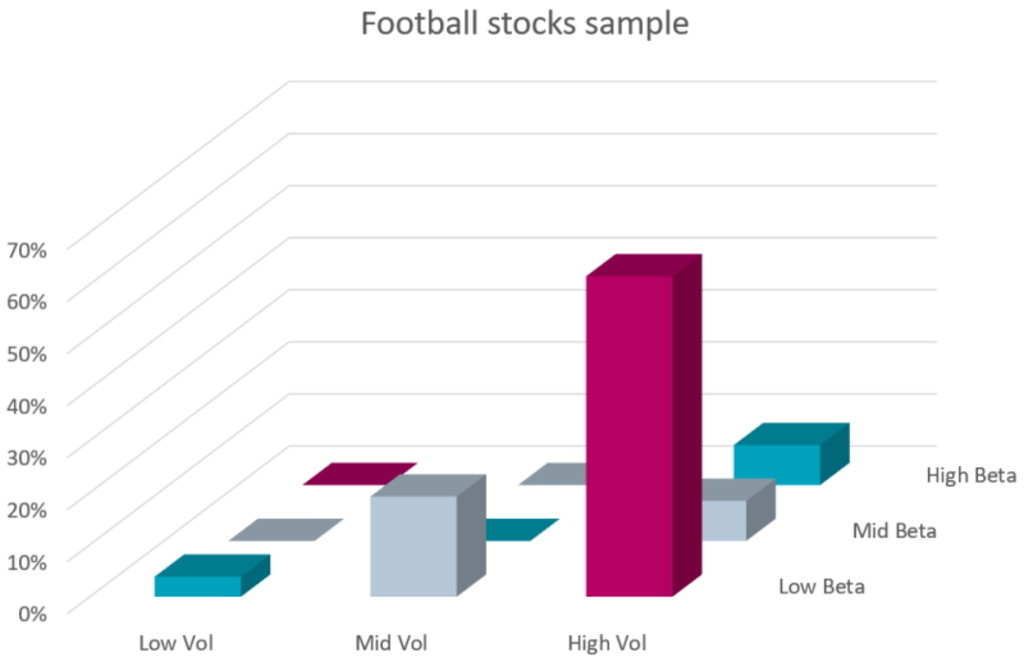
Source: Robeco, Refinitiv. The figure shows the distribution of Europe football stocks in volatility and beta groups. The football stocks are sorted into three volatility buckets and three beta buckets based on the same breakpoints as in Figure 2. The sample period is January 1997 to March 2023.
The return of football stocks
The return of the aggregate football index versus the MSCI Europe index by calendar year is shown in Figure 4. Return variations of 20% or 30% in a single year are no rarity, underlining the high volatility of football stocks. The low beta of football stocks is apparent in years like 2008 (global financial crisis) and 2022 (tech crash), when football stocks massively outperformed the market, demonstrating their rather uncorrelated behavior.
Unfortunately, large underperformances have been considerably more frequent (48% of the years) than large outperformances (just 30% of the years). Over the full sample, the return of the football index lagged the market by almost 6% per annum.
Figure 4: Calendar year return of football clubs versus MSCI Europe
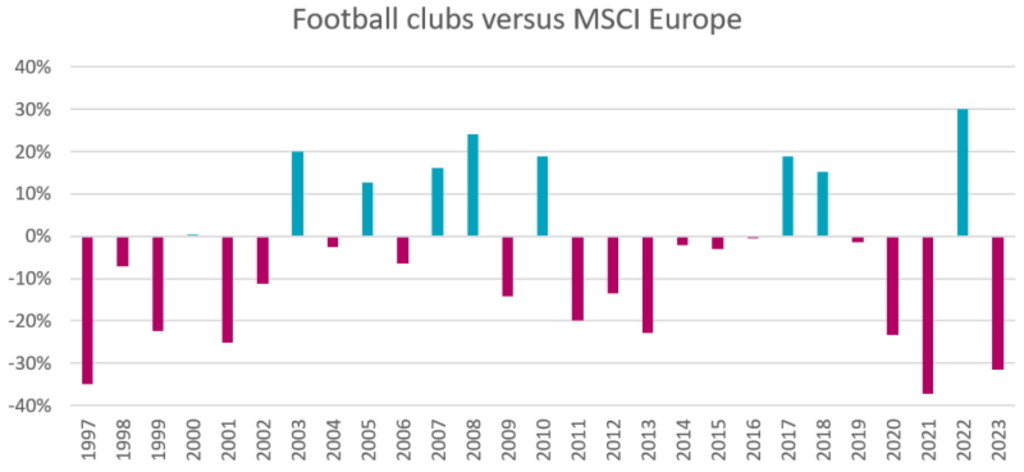
Source: Robeco, Refinitiv. The figure shows the return spread between European football stocks and the MSCI Europe Index. Portfolios are value-weighted and updated monthly. The constituents of the football portfolio are presented in Figure 1. The sample period is January 1997 to March 2023.
We have published extensively on the low-risk anomaly - the phenomenon that low-risk stocks deliver market-like (or superior) long-term returns with substantially lower risk, whereas high-risk stocks generate poor long-term returns despite their high risk.4 The same conclusion applies regardless of whether volatility or beta is used as a risk measure, which is unsurprising given their usual high correlation.5 However, football stocks, due to their contrasting volatility and beta characteristics, present a unique opportunity to assess which metric is a more important determinant of expected return.
To this end, we compare the long-term return of the football index with the returns of volatility- and beta-sorted portfolios in the MSCI Europe universe. We consider value-weighted tertile portfolios for volatility and beta estimated on daily data over a one-year lookback period. Figure 5 shows that the low-risk anomaly is clearly present among European stocks. In terms of long-term return, the low-volatility and low-beta portfolios come out on top, while the high-volatility and high-beta portfolios end up last. Although volatility seems slightly more potent than beta, the differences are small. This is consistent with the extensive literature on the low-risk anomaly.
Figure 5: Cumulative performance of football, volatility, and beta portfolios
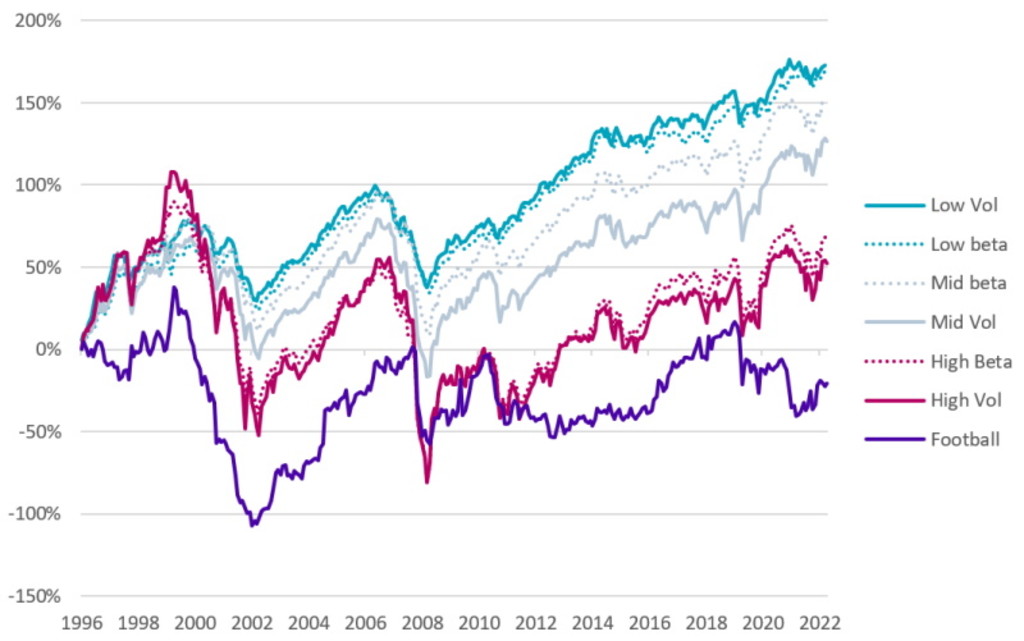
Source: Robeco, Refinitiv. The figure shows the cumulative excess return over the risk-free rate of European football stocks and stock tercile portfolios based on 260-day volatility and beta. Portfolios are value-weighted and updated monthly. The constituents of the football portfolio are presented in Figure 1. The investment universe of the tercile portfolios consists of the MSCI Europe Index constituents. The sample period is January 1997 to March 2023.
Turning to the portfolio of football stocks, we observe that they have the worst performance of all. In fact, their long-term cumulative excess return has been negative, meaning that an investment in football stocks underperformed even risk-free cash holdings. Given their extensive short-term return fluctuations and disappointing long-term average return, football stocks bear more resemblance to high-risk stocks than low-risk stocks. Thus, the high volatility of football stocks appears to be a better indicator of these stocks' performance behavior than their low beta. So when volatility and beta conflict, the evidence from football stocks suggests that investors should let volatility prevail over beta.
獲取最新市場觀點
訂閱我們的電子報,時刻把握投資資訊和專家分析。
Football stocks as lottery tickets
A common rationale for the low-risk anomaly is that speculative investors willingly overpay for risky stocks due to a preference for lottery-like properties, i.e., a chance to hit the jackpot.6 Our sample contains some striking examples of this. For instance, Borussia Dortmund returned 138% in the 2010-2011 season when they unexpectedly clinched the championship after a long dry spell, Celtic returned 159% in the 2006-2007 season when they secured the national title and made it past the group stages in the Champions League, and Fenerbahçe generated a whopping 190% return in the 2007-2008 season when they reached the quarter-finals of the Champions League.
However, much like lotteries yield more losers than winners, the occasional big payoffs of some football stocks go hand-in-hand with poor returns in many other periods. Thus, while football stocks might be great for a lucky few who happen to choose the right club at the right moment, most investors end up disappointed.
Of course, die-hard fans might derive a certain non-financial utility from investing a small part of their wealth in the clubs they passionately support. However, from a purely financial perspective, the analysis in this article demonstrates that, despite their seemingly attractive low-beta characteristics, football stocks are generally not a desirable long-term investment opportunity.
Footnotes
1 Also known as the Serie A scandal. It erupted in May 2006 and implicated several top Italian football clubs, including Juventus, AC Milan, Fiorentina, Lazio, and Reggina, in a match-fixing controversy. Juventus was the most severely penalized, stripped of its 2005 and 2006 Serie A titles and relegated to Serie B with a significant points deduction for the 2006-2007 season. The scandal, which involved club officials influencing referee appointments, led to substantial changes in Italian football administration.
2 We looked at the constituents of football stock indices that used to be available in the past, which includes football stocks that have since been delisted.
3 Although our sample contains a few stocks from emerging markets (Turkey, Poland) or even frontier markets (North Macedonia) we use the regular MSCI Europe index as a reference point.
4 For an extensive overview we refer to Blitz, van Vliet, and Baltussen, 2020. “The Volatility Effected Revisited”, Journal of Portfolio Management, volume 64, issue 2, pages 45-63.
5 We tend to find slightly stronger results for volatiltiy than for beta but the main conclusion is the same.
6 See Barberis and Huang, 2008. “Stocks as Lotteries: The Implications of Probability Weighting for Security Prices”, American Economic Review, volume 98, issue 5, pages 2066-2100.
重要資料
本網站僅供《證券及期貨條例》(香港法例第571章)及其附屬法例所界定之專業投資者瀏覽及使用。 投資涉及風險。過往表現並不代表未來表現。本網站所載資料僅供參考之用,並不構成任何投資建議,亦非作出買賣任何證券或採納任何投資策略之要約或招攬。投資者不應僅憑本網站提供之資料作出投資決定,在作出任何投資決定前,應徵詢獨立意見(包括有關稅務影響之意見)。投資者應確保完全理解投資產品的相關風險,亦應考量自身投資目標及風險承受水平。投資乃閣下之個人決定。除非銷售投資產品的中介人已向閣下告知該投資產品適合閣下,並已解釋其符合閣下投資目標之原因,否則閣下不應投資。請參閱相關發售文件或其他法律文件,以獲取包括風險因素在內的進一步詳情。 本網站由荷寶投資管理香港有限公司發布,該公司受香港證券及期貨事務監察委員會(「證監會」)規管(中央編號:APU851)。本網站未經證監會審閱。 無法保證任何投資產品可實現其投資目標。概不就任何投資產品之表現或投資回報作任何聲明或承諾。投資的價值或會波動。本網站所載過往表現、推算或預測,均不應視作未來表現之保證或指標,且概不提供任何明示或暗示之保證。本網站內容建基於相信為可靠之來源,惟因應資料傳遞技術特性及須採用多項數據來源(包括第三方內容),故概不保證其準確性。所述觀點僅乃截至上述日期,或會隨市況變化而改變,可予更改而毋須另行通知。該等意見可能有別於其他荷寶投資專業人士之意見。因使用本材料或當中所載任何評論、意見或估算而引致之直接、間接或相應損失,荷寶概不承擔法律責任。荷寶並無責任更新本網站或任何網站內容。未經荷寶事先書面許可,不得複製、分發或刊發本網站任何材料。 除非另有說明,資料來源:荷寶。