Researcher
探索量化價值
訂閱我們的電子報,獲取尖端的量化策略和見解。






In the first half of 2023, stock markets experienced a substantial rebound. The MSCI World Index surged by 15% in USD, regaining more than two-thirds of the losses from the previous year. Interestingly, this comeback is largely driven by a handful of prominent US tech stocks, including Alphabet (Google), Amazon, Apple, Microsoft, Meta (Facebook), Nvidia, and Tesla. Some have dubbed these stocks the ‘Magnificent Seven’, while others have coined terms inspired by quant investing, such as MAMANTAm (momentum), or superheroes, such as FATMAAN and MANTAMAN, all replacing the previously used term, FANG. 1




This narrow market raises crucial questions about market diversification. While the MSCI World Index comprises more than 1,500 stocks, the top 10 make up just more than 20% of the total index. One way to assess market concentration is through ‘effective N,’ a metric that compares the balance between portfolios with diverse weights versus those that are highly skewed. For instance, in a portfolio of 100 stocks with equal weights, the effective N would be 100. In contrast, if a single stock dominated 99.9% of a 100-stock portfolio, the effective N would be closer to 1.
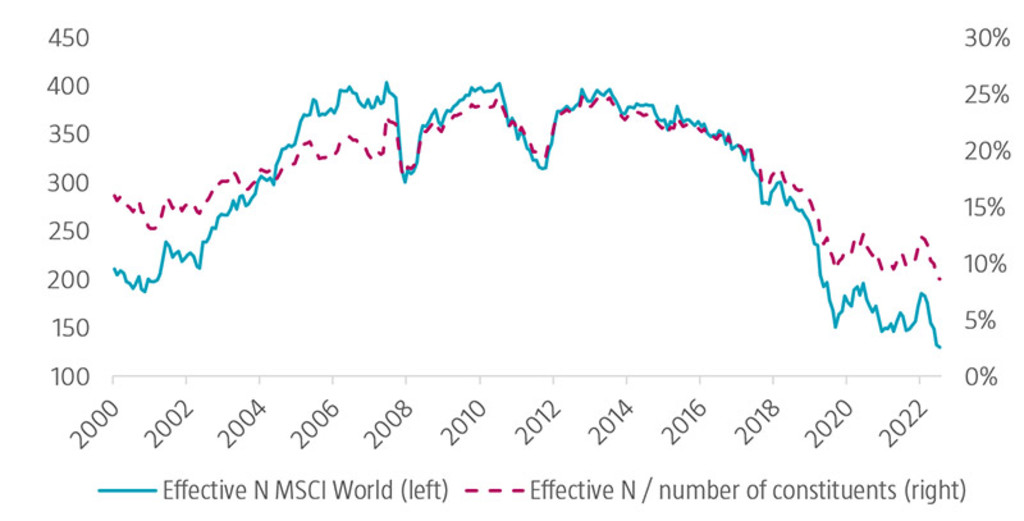
Source: Robeco, Refinitiv. The figure shows the effective N (left axis) and the ratio of the effective N relative to the total number of constituents (right axis) for the MSCI World Index over time. Effective N is calculated as the inverse of the Herfindahl-Hirschman Index (HHI) for portfolio weights, where HHI is the sum of the squared stock weights.
The sample period is December 2000 to June 2023.
Figure 1 visualizes the effective N as well as the effective N relative to the number of all constituents for the MSCI World over time. For many years the effective N hovered between 300 and 400, but since 2018 has steadily declined, reaching a low of 130 at the end of June 2023. Consequently, the effective N is now less than a tenth of the total number of index constituents, indicating a significant concentration.
This trend suggests that investing in the MSCI World Index may not offer the diversification one might assume based on the sheer number of constituents. Given that the dominant stocks are all US based, tech-focused, and carry high valuations, they inherently share similar risks. Therefore, investors may want to consider diversifying their investments by exploring opportunities in international markets, small-cap stocks, and alternative investment strategies not solely based on capitalization weight.
1 Mackintosh, J., June 2023, “FATMAAN and MANTAMAN: Superhero Acronyms for Super Stocks”, Wall Street Journal.
訂閱我們的電子報,獲取尖端的量化策略和見解。
本網站僅供《證券及期貨條例》(香港法例第571章)及其附屬法例所界定之專業投資者瀏覽及使用。 投資涉及風險。過往表現並不代表未來表現。本網站所載資料僅供參考之用,並不構成任何投資建議,亦非作出買賣任何證券或採納任何投資策略之要約或招攬。投資者不應僅憑本網站提供之資料作出投資決定,在作出任何投資決定前,應徵詢獨立意見(包括有關稅務影響之意見)。投資者應確保完全理解投資產品的相關風險,亦應考量自身投資目標及風險承受水平。投資乃閣下之個人決定。除非銷售投資產品的中介人已向閣下告知該投資產品適合閣下,並已解釋其符合閣下投資目標之原因,否則閣下不應投資。請參閱相關發售文件或其他法律文件,以獲取包括風險因素在內的進一步詳情。 本網站由荷寶投資管理香港有限公司發布,該公司受香港證券及期貨事務監察委員會(「證監會」)規管(中央編號:APU851)。本網站未經證監會審閱。 無法保證任何投資產品可實現其投資目標。概不就任何投資產品之表現或投資回報作任何聲明或承諾。投資的價值或會波動。本網站所載過往表現、推算或預測,均不應視作未來表現之保證或指標,且概不提供任何明示或暗示之保證。本網站內容建基於相信為可靠之來源,惟因應資料傳遞技術特性及須採用多項數據來源(包括第三方內容),故概不保證其準確性。所述觀點僅乃截至上述日期,或會隨市況變化而改變,可予更改而毋須另行通知。該等意見可能有別於其他荷寶投資專業人士之意見。因使用本材料或當中所載任何評論、意見或估算而引致之直接、間接或相應損失,荷寶概不承擔法律責任。荷寶並無責任更新本網站或任何網站內容。未經荷寶事先書面許可,不得複製、分發或刊發本網站任何材料。 除非另有說明,資料來源:荷寶。
警告 — 有不法分子在網站及社交媒體上冒用荷寳 了解更多