市場觀點
最新市場觀點
焦點文章
市場觀點及展望
教育
網絡研討會和活動
產品
搜尋基金
投資策略
投資機會
可持續投資
開始旅程
影響力
專業知識
轉型投資
可持續發展目標
氣候投資及生物多樣性
關於荷寶
我們的信念
主要優點
企業管治
歷史
多元與包容
聯絡荷寶
search
user
languages
專業投資者 | 香港
menu
市場觀點
對專業投資者而言,了解市場走向及其影響可說是最艱巨的任務。他們必須對投資市場有深入的研究和見解,因此我們在這個領域不斷投放大量精力。我們對自己的專業領域有深入的了解,並積極與您分享我們的觀點。因為只有分享知識,才能促進社會繁榮。
05-02-2026
· 市場觀點
Consumer trends in 2026: Safety, security and the wearables comeback
了解更多
872 文章
搜尋
焦點主題
焦點主題
可持續投資
量化投資
信貸
主題投資
新興巿場
內容類型
內容類型
市場觀點
月度展望
季度展望
播客
研究
視頻
地區
地區
亞洲
中國
新興巿場
歐元區
美國
策略
策略
綜合固定收益
亞太區股票
買進持有信貸
中國股票
氣候投資
信貸
防衛型股票
指數增強股票策略
歐元政府債券
新興市場股票
基本面價值股票
綠色債券
高信心股票
高收益債券
多元資產
主動式量化股票策略
量化固定收益
房地產股票
可持續發展目標投資
可持續指數解決方案
趨勢投資
Back
過濾器
移除所有
Reset
焦點主題
內容類型
地區
策略
顯示基金
過濾器 (0)
13-02-2026
· 播客
Podcast: Geopolitics and AI boost emerging markets prospects
了解更多
11-02-2026
· 研究
Liquidity at risk: Water scarcity’s impact on chemical company fundamentals
了解更多
09-02-2026
· 月度展望
Shiny objects, solid returns
了解更多
06-02-2026
· 數據集
Data sets – factor investing in corporate bonds
了解更多
06-02-2026
· 市場觀點
Sustainable Asia is rich with alpha opportunities
了解更多
05-02-2026
· 市場觀點
The ‘Great Rebalance’ – themes poised for growth as markets broaden
了解更多
裝載更多
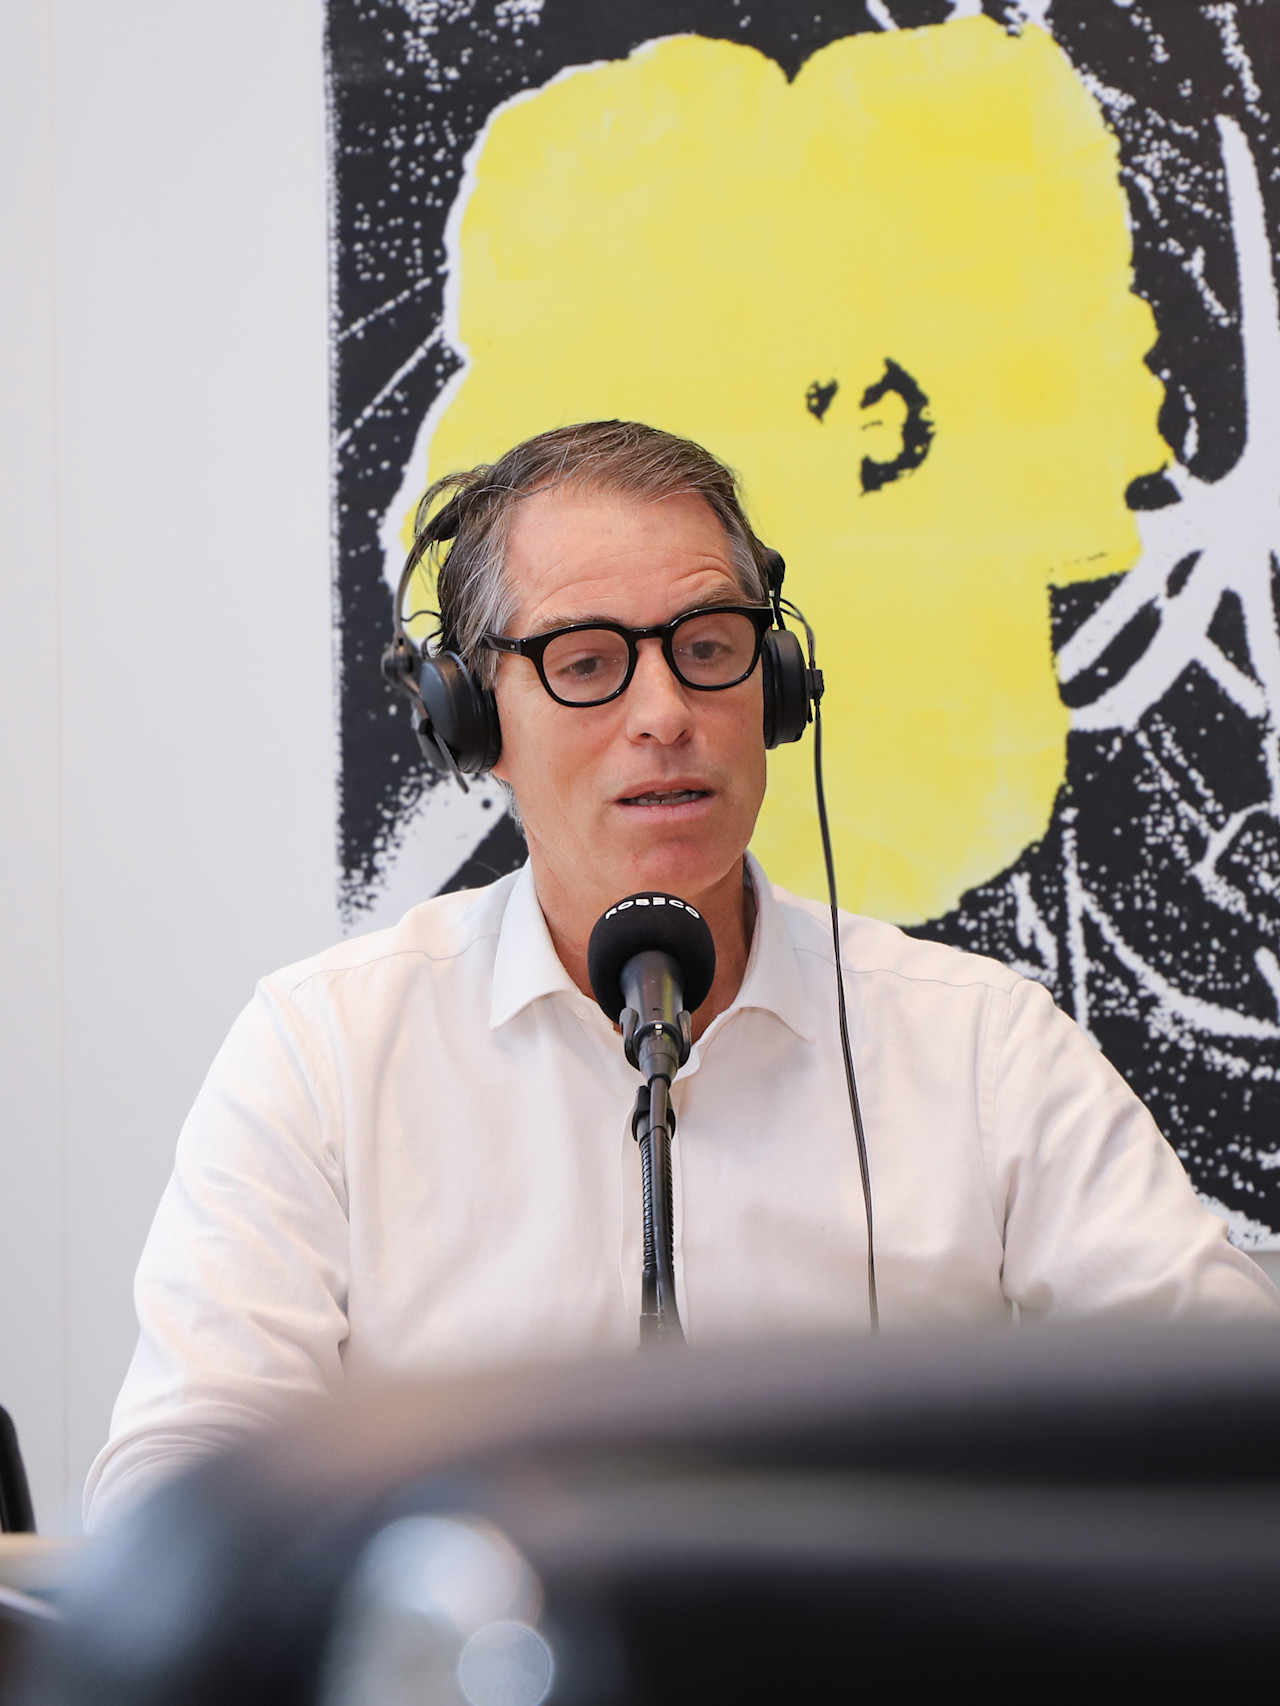
視頻和播客
查看全部
13-02-2026
· 播客
Podcast: Geopolitics and AI boost emerging markets prospects
了解更多
30-01-2026
· 播客
Podcast: Searching for gems in the credit markets
了解更多
23-01-2026
· 播客
Podcast: In tune with the markets – Pain and gain
了解更多
18-12-2025
· 播客
Podcast: Will listed property bounce back in 2026?
了解更多
12-12-2025
· 播客
Podcast: In tune with the markets – El Classico
了解更多
27-11-2025
· 播客
Podcast: Emerging markets are firing on all cylinders
了解更多
21-11-2025
· 播客
Podcast: In tune with the markets – In the dark
了解更多
17-10-2025
· 播客
Podcast: In tune with the markets – Gold fever strikes again
了解更多
10-10-2025
· 播客
Podcast: Reports of the death of ESG investing are greatly exaggerated
了解更多
19-09-2025
· 播客
Podcast: In tune with the markets – Nervous dancer
了解更多
16-09-2025
· 播客
Podcast: 5-year Expected Returns – The Stale Renaissance
了解更多
29-08-2025
· 播客
Podcast: The skeptical value investor
了解更多
22-08-2025
· 播客
Podcast: In tune with the markets - Gambling with governance
了解更多
23-07-2025
· 播客
AI course – AI horizons
了解更多
18-07-2025
· 播客
Podcast: In tune with the markets – Humming along
了解更多
09-07-2025
· 播客
AI course – AI milestones
了解更多
2026年展望報告:同步轉變
多年不確定性過後,2026年有望迎來一場罕見而短暫的復甦。
了解更多