
• インサイト
Convergence of drivers give renewed energy to renewable stocks
An overhaul of industrial policies in the US and EU is laying the groundwork for robust growth in renewable energy value chains.
まとめ
- Carbon pricing schemes are raising the stakes for high emitters
- Unprecedented government stimulus provides strong incentives
- Clean tech financing and reshoring policies support fresh growth
Carbon pricing mechanisms have been in place for decades but their use as a carbon-combat tool has gained momentum as a result of the Paris Agreement and the global commitment to the net-zero transition. Prices in the EU’s Emissions Trading System (ETS), one of the largest carbon credit markets globally, are set to rise as more stringent regulations passed in late spring kick in. China, the world’s largest emitter, just recently launched a national ETS covering 40% of its domestic emissions and is set to expand its scope to cover more sectors in the coming years. In the US, California is tightening the supply of credit allowances and many more states either have or are considering state-wide cap and trade systems.
According to the World Bank, close to a quarter of global emissions are now covered by a carbon tax or emissions trading scheme (ETS), up from just 7% a decade ago. Still, carbon prices in many regions are still too low to function as an effective deterrent.1 But that is set to change as we approach 2030, when countries are forced to make good on their Paris-agreed pledges.
Figure 1 Carbon prices are set to rise in the run-up to 2050
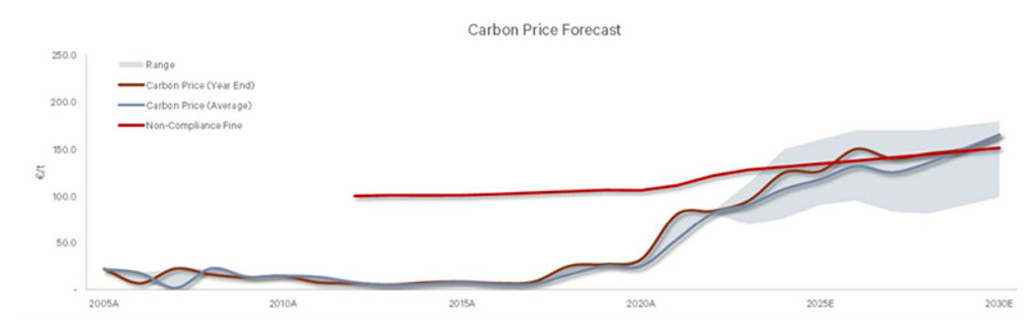
Source: Berenberg, Robeco
Carbon pricing incentivizes power generators to be more efficient with fossil fuel inputs. The levelized cost of emitting one unit of energy in a coal plant roughly doubles when the carbon allowance goes from €10 to a €100 (which it did in the period 2018-2022). And the operational cost of a natural gas turbine increases roughly 50-60%. Costs can spiral even higher with increasing market prices for coal and gas in response to changing supply-demand dynamics (which energy markets experienced in 2021-2022).
Carbon prices in many regions are still too low to function as an effective deterrent. That is set to change as we approach 2030 and countries are forced to make good on their Paris-agreed pledges
Positive cost and financing trends
In addition to being cleaner, renewable energy is now cheaper than fossil fuels. A combination of technological advancements, economies of scale, decreasing component costs and government backing, solar and wind has now become cost-competitive with traditional fossil fuels in many markets globally, see Figure 2. With the cost-benefit analysis so clearly on the side of renewables, it is no surprise that solar investments are expected to overtake oil for the first time in 2023 (USD 382 billion vs 371 billion, respectively).2
Figure 2. Wind and solar costs are falling globally
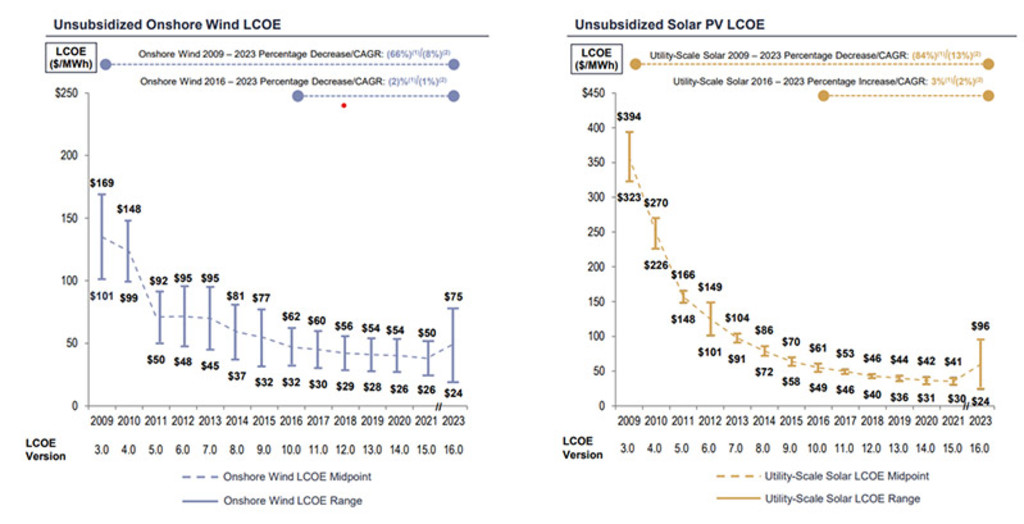
Source: Lazard, 2023
Despite lower production costs, 2023 has proven to be a difficult year for clean energy stocks. Higher interest rates have increased borrowing costs and capex outlays. Performance of growth-oriented clean-tech stocks and infrastructure-heavy renewable energy developers have been particularly disappointing. What’s more, the regional banking crisis in the US has raised concerns over the availability of financing to cover future capacity expansion.
This scenario seems unlikely however given the US government’s unprecedented commitment to decarbonize its energy sector and overall economy via the Inflation Reduction Act (IRA). Moreover, it is just one of three transformative pieces of legislation passed since 2021, all aimed at greening energy production and consumption across critical sectors of the US economy, including power, buildings, transport, manufacturing and other heavy-carbon industries. Combined, the financing power behind the US clean energy policies could reach well over USD 400 billion over the next five to ten years.3
Combined, the financing power behind the US clean energy policies could reach well over USD 400 billion over the next five to ten years
The EU is also transforming its industrial policies to not only align with its net zero emission ambitions but also ensure those ambitions are served by EU manufacturers. Its Green Deal Industrial Plan announced early this year, earmarks EUR 270 billion to buildout its cleantech industrial capacity and to fast-track the financing, production and deployment of net-zero technologies. Moreover, access to more financing from REPowerEU directive and the covid-era Recovery and Resilience Facility (RFF) and the EU Innovation Fund could easily push available clean tech stimulus to well over EUR 550 billion.4
Reshoring creates tailwinds for solar value chain
Renewable energy markets in the EU and US should also benefit from re-shoring and friend-shoring trends aimed at increasing the security and resiliency of critical supply chains. In addition to helping countries reduce emissions, the EU Green Industrial Plan, the US’s IRA and CHIPs acts are also designed to take back control over procurement and manufacturing of strategic technologies. These include semiconductors, solar photovoltaic (PV) panels, batteries, EVs and various supporting sub-industries that constitute their value chains. Top-down directives are being met by bottom-up action from individual countries. France and Germany have already announced plans to build-out solar manufacturing capacity, while Spain has launched a program to attract solar manufacturing investments.
Strong short and long term outlook
A number of formidable structural shifts are converging to create robust short-, mid- and long-term growth opportunities for Smart Energy investments. Carbon pricing mechanisms are gaining traction in major markets globally, increasing costs for high-emitting sectors and incentivizing the switch to renewables and energy-efficient technologies. In addition, governments globally are overhauling their industrial policies in response to climate change, introducing unprecedented financing incentives to support the build out of renewable energy capacity and the decarbonization of domestic economies.
Moreover, the US and EU, are working to build and protect domestic supply chains in strategic areas. These include key industries all along the energy value chain from solar power generation to energy storage solutions such as batteries and hydrogen. Moreover, strategic, reshoring policies will also strongly impact other smart energy solutions including energy-saving semiconductors for data processing, EVs in transportation and heat pumps in buildings.
Though valuations in some energy market segments, notably renewable producers, have declined due to high interest rates and investment financing concerns, these factors should recede as rates hikes cool and government financing materializes. Moving forward, lower valuations create attractive entry points ahead of a renewable market reboot triggered by higher carbon costs, a tripling of renewable installations through 2030, and supportive industrial policies.
Footnotes
1 Most experts agree that prices should be at least USD 125 per metric ton of CO2 equivalents before 2025 and higher than USD 200 per ton by 2030 if net-zero targets have not been reached.
2 International Energy Agency, World Energy Investment Report, 2023
3 This counts the IRA clean energy credits (USD 300 billion) plus the Bipartisan Infrastructure Law’s USD 70 billion in funding for clean energy technology and infrastructure upgrades. In addition, the US CHIPs and Science Act provides more than USD 50 billion for the expansion of US semiconducting capacity, a key enabler for clean tech industries. Source: McKinsey.
4 European Commission. The Green Deal Industrial Plan Fact Sheet. February 2023.
重要事項
当資料は情報提供を目的として、ロベコ・ジャパン株式会社(以下「当社」)が独自に作成、または当社のグループ会社(Robeco Institutional Asset Management B.V.およびその関連会社を含む)から提供された資料を当社が編集・翻訳したものです。資料中の個別の金融商品の売買の勧誘や推奨等を目的とするものではありません。記載された情報は十分信頼できるものであると考えておりますが、その正確性、完全性を保証するものではありません。意見や見通しはあくまで作成日における弊社の判断に基づくものであり、今後予告なしに変更されることがあります。運用状況、市場動向、意見等は、過去の一時点あるいは過去の一定期間についてのものであり、過去の実績は将来の運用成果を保証または示唆するものではありません。また、記載された投資方針・戦略等は全ての投資家の皆様に適合するとは限りません。当資料は法律、税務、会計面での助言の提供を意図するものではありません。 ご契約に際しては、必要に応じ専門家にご相談の上、最終的なご判断はお客様ご自身でなさるようお願い致します。 運用を行う資産の評価額は、組入有価証券等の価格、金融市場の相場や金利等の変動、及び組入有価証券の発行体の財務状況による信用力等の影響を受けて変動します。また、外貨建資産に投資する場合は為替変動の影響も受けます。運用によって生じた損益は、全て投資家の皆様に帰属します。したがって投資元本や一定の運用成果が保証されているものではなく、投資元本を上回る損失を被ることがあります。弊社が行う金融商品取引業に係る手数料または報酬は、締結される契約の種類や契約資産額により異なるため、当資料において記載せず別途ご提示させて頂く場合があります。具体的な手数料または報酬の金額・計算方法につきましては弊社担当者へお問合せください。 当資料及び記載されている情報、商品に関する権利は弊社に帰属します。したがって、弊社の書面による同意なくしてその全部もしくは一部を複製またはその他の方法で配布することはご遠慮ください。 商号等: ロベコ・ジャパン株式会社 金融商品取引業者 関東財務局長(金商)第2780号 加入協会: 一般社団法人 資産運用業協会