Sustainable Investing
Environmental Footprint Reporting is part of Robeco’s sustainability reporting tool, ESGenius. The tool quantifies the environmental footprint of portfolio companies using data on their greenhouse gas emissions, water use and waste generation and helps investors measure the environmental footprint of their portfolios.
Footprint reports can be generated for Robeco’s entire range of products. Though reports are backward looking, when used in combination with other ESG research and other forward-looking data, they contribute to a company’s overall sustainability profile.
Which types of environmental footprint are measured?
Greenhouse gas (GHG) emissions – measures aggregate Scope 1 and Scope 2 emissions. Scope 1 are direct emissions generated by company-owned or -controlled sources. Scope 2 are indirect emissions associated with purchased electricity or heat from upstream utilities or other suppliers. Scope 3 include emissions generated downstream by company customers. The tool allows separate reporting on Scope 1, 2, and 3.
Water use – measures the total volume of freshwater used by a company to produce goods and services and includes water volumes consumed (evaporated or incorporated into a product) and/or polluted.
Waste generation – measures dry waste, the residual by-product of a company’s production processes that is intended to be discarded.

Creating returns that benefit the world we live in
How is a portfolio’s footprint calculated?
To calculate the environmental footprint associated with the portfolio, each type of footprint must first be converted (or normalized) into a portfolio’s unit of measure – asset value as measured in millions of USD. Each footprint is normalized by dividing it by the company’s enterprise value. The end result is expressed per 1 million USD invested in the company.
To illustrate, consider a company that emits 500 million metric tons of CO2-equivalents (tCO2-eq) per year and has an enterprise value of USD 10 million. Its end GHG footprint will be 50 metric tons of CO2-eq for every million USD invested. This normalized footprint is then multiplied by the respective company’s weight in the portfolio. If we assume investments in the company represent 10% of the portfolio, then the portfolio attributed emissions from holding this company is 5 tCO2eq per one million USD invested.
Footprint values are calculated for each portfolio company and then aggregated across all portfolio constituents to yield a final footprint value. For comparison, environmental footprints are also calculated for the constituents of the portfolio’s respective benchmark. Figure 1 displays the environmental footprints associated with both the portfolio and its benchmark.
The associated GHG emissions for the company above constitute around 9% (5/56.3 tCO2eq) of the portfolio’s entire emissions footprint. Moreover, the portfolio’s associated emissions are 18.9% lower than those of its market benchmark.
Figure 1 Sample – Environmental Footprint Report
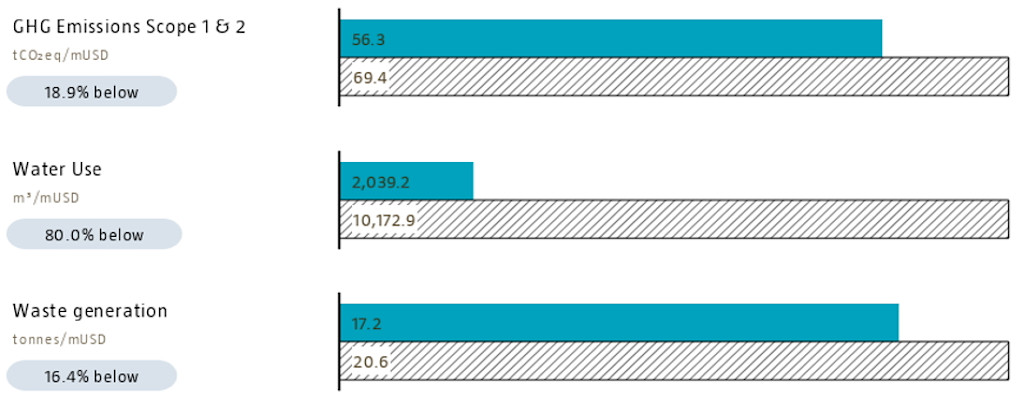
Source: Robeco data based on Trucost data. S&P Trucost Limited © Trucost 2022. All rights in the Trucost data and reports vest in Trucost and/or its licensors. Neither Trucost, nor its affiliates, nor its licensors accept any liability for any errors, omissions or interruptions in the Trucost data and/or reports. No further distribution of the Data and/or Reports is permitted without Trucost's express written consent.