Chief Researcher


• Research
Shrunk betas can fortify Low-risk portfolios
Research shows that beta forecasts are improved by shrinking correlations more than relative volatilities. In turn, these superior estimates can be used in low-risk portfolios to enhance their risk-return outcomes.
Authors




Head of Conservative Equities and Chief Quant Strategist

Head of Solutions Research

Researcher
Summary
- Accuracy of beta forecasts can be improved by shrinking correlations more than volatilities
- Asymmetric beta shrinkage results in portfolios with lower risk and higher alpha
- But sorting stocks on volatility and beta is a simpler alternative, with similar results
In the capital asset pricing model (CAPM), beta is used to describe how the returns of a particular stock (or portfolio) are related to those of the market. It is defined as the correlation between a specific stock (or portfolio) and the market, multiplied by the relative volatility of the stock (or portfolio) versus the market.
Beta is, however, an unobserved characteristic that needs to be estimated. Thus, finding the best way to forecast the beta of securities is an important consideration for academics and practitioners. But more importantly, dealing with the accompanying estimation error is a crucial step in the process. Robeco researchers tackled these issues in an academic paper1 that focused on beta estimations using shrinkage techniques, by looking at the US stock market from January 1963 to December 2017.
For the study, the authors assumed that correlations and relative volatilities are independent of each other, such that beta expectations are equal to the product of these two estimated components. To examine which approach best forecasts beta, they analyzed a range of methods, from those that shrink the beta in its entirety, to others that reduce estimation errors in correlations and relative volatilities to their cross-sectional averages separately.
To investigate the effect of implementing shrinkage on correlations and relative volatilities, they looked at the resulting mean squared errors (MSE) of the beta estimates when correlations and relative volatilities were shrunk at different levels. This ranged from a shrinkage factor of 0 to 1 for both parameters.
The analysis confirmed that the largest estimation error – or highest MSE – occurred when no shrinkage was implemented. Meanwhile, a two-parameter approach – that reduced correlations (0.5 shrinkage factor) more than relative volatilities (0.2 shrinkage factor) – produced the best outcome (or lowest MSE). Moreover, one-parameter settings generally delivered suboptimal results.
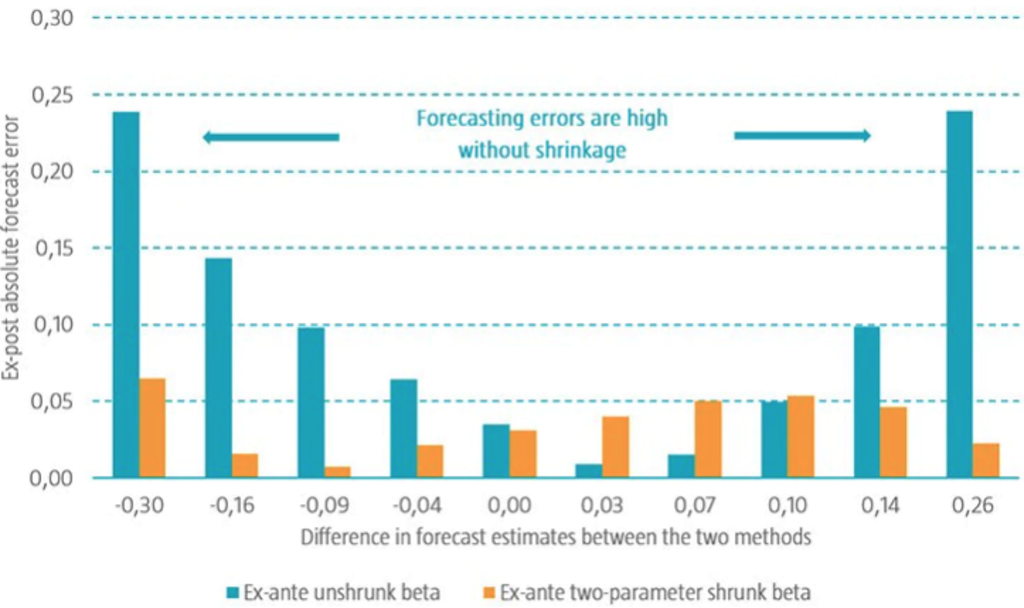
The researchers also scrutinized stocks that had the most dissimilar beta predictions when the no shrinkage and two-parameter shrinkage approaches were applied. This comparison was also made between the related estimates of the one-parameter shrinkage and two-parameter shrinkage settings. Thereafter, the stocks were ranked on the differences in beta forecasts between these methods and allocated to 10-decile portfolios. The average ex-ante beta estimates for these portfolios were then compared with their realized betas over the full sample period.
The results revealed that the two-parameter shrinkage method had lower forecasting errors than the other two approaches. Indeed, Figure 1 shows the ex-post absolute beta forecast error for both the no shrinkage and two-parameter shrinkage settings for each of the 10-decile portfolios, while the horizontal axis reflects the differences in ex-ante average beta estimates between the two methods.
Figure 1 | Decile portfolios sorted on beta estimate differences between no shrinkage and two-parameter shrinkage methods
Source: Blitz, D., Swinkels, L., Ūsaitė, K., and Van Vliet, P., December 2021, “Shrinking beta”, SSRN working paper.
Improved ex-ante beta estimates at the individual stock level led to lower ex-post portfolio betas
Shrunk betas result in less risky portfolios
The authors also assessed whether these improved ex-ante beta estimates at the individual stock level led to lower ex-post portfolio betas. They ranked stocks on their historical beta estimates and allocated them to 10-decile portfolios. The same exercise was performed using the two-parameter shrinkage beta forecasts. In addition, a long-short strategy based on a long position in the D1 portfolio (lowest beta estimates) and short position in D10 portfolio (highest beta estimates) was constructed.
For the strategies based on historical beta estimates, the results showed that the D1 portfolio had an average excess return of 7.26%, volatility of 11.04%, Sharpe ratio of 0.66, and market beta of 0.45. On the other hand, the D10 portfolio also had an average return of 7.26%, but a volatility of 32.59%, Sharpe ratio of 0.22, and a market beta of 1.65. Meanwhile, the long-short portfolio exhibited an alpha of 10.14% relative to the CAPM.
For the strategies based on the two-parameter shrinkage beta estimates, the D1 portfolio had a lower ex-post beta (from 0.45 to 0.42) and a lower realized volatility (from 11.04% to 10.79%). In addition, the D10 portfolio had a higher volatility and a higher ex-post beta. This also indicates that risk can be better predicted on an overall portfolio level. Finally, the long-short portfolio delivered a CAPM alpha that was almost 2% higher (from 10.14% to 11.87%) and that was statistically significant.
Comparing low beta and Low Volatility portfolios
In their paper, the researchers found that beta predictions were more accurate when correlations were shrunk more to their cross-sectional average than relative volatilities. For portfolio construction purposes, these results could be seen as a reason to allocate less weight to estimated correlations than forecasted relative volatilities. To assess this notion, the authors took a different approach and formed portfolios based on either two-parameter shrunk betas, volatility, or a combination of these two variables. This analysis gave them insight on the effect of including correlations alongside volatilities, thereby connecting the literature of low beta and low volatility investing.
When different portfolio combinations based on shrunk beta estimates and volatilities were evaluated, the results revealed that including correlation significantly reduced the volatility of a low-risk portfolio. Therefore, this indicates that correlation is indeed an important element to consider within a low volatility portfolio.
An equally weighted combination of unshrunk betas and volatility are most effective in reducing volatility
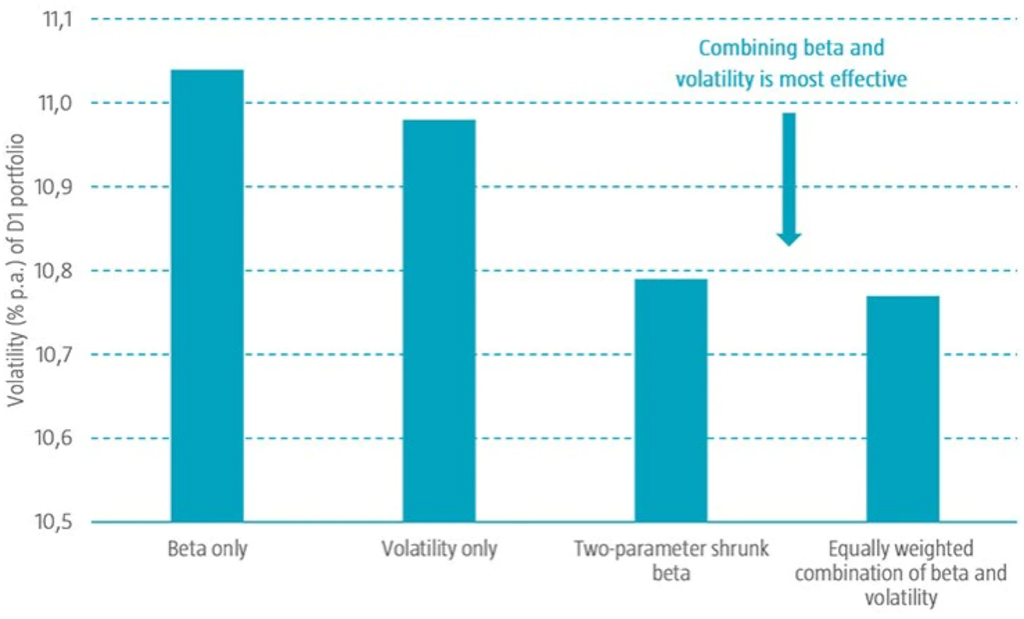
However, sorting stocks into portfolios based on their conventional betas gives too much weight to the correlation, which is less accurately forecasted. This can be reduced, however, by shrinking correlations more to their cross-sectional average than volatilities, or by combining conventional betas with pure volatility estimates. This latter approach of equally combining beta and volatility is less complex because there is no need to estimate shrinkage parameters.
This concept is illustrated in Figure 2, which shows that the portfolios based only on conventional beta exhibit the highest realized volatility. Furthermore, it depicts that standalone volatility is a better predictor than standalone beta. Meanwhile, those that are based on two-parameter shrunk betas or use an equally weighted combination of unshrunk betas and volatility are most effective in reducing volatility.
Figure 2 | Comparing the realized volatilities of portfolios based on four different construction methods
Source: Blitz, D., Swinkels, L., Ūsaitė, K., and Van Vliet, P., December 2021, “Shrinking beta”, SSRN working paper.
All in all, the results from this research paper indicate that correlations can help enhance the risk-return outcomes of low-risk portfolios. But since they are less accurately estimated than volatilities, they should be handled with care.
Footnote
1Blitz, D., Swinkels, L., Ūsaitė, K., and Van Vliet, P., December 2021, “Shrinking beta”, SSRN working paper.
Important information
THIS WEBSITE IS SOLELY INTENDED FOR PROFESSIONAL INVESTORS, WHICH HAS THE MEANING ASCRIBED TO IT IN THE SECURITIES AND FUTURES ORDINANCE (CAP. 571 OF THE LAWS OF HONG KONG) AND ITS SUBSIDIARY LEGISLATION. Investment involves risks. Past performance is not indicative of future performance. The information contained in this website is provided for reference only and does not constitute investment advice or an offer or solicitation to buy or sell in any securities or to adopt any investment strategy. Investors should not base their investment decisions solely on the information provided on this website and are advised to seek independent advice (including advice on tax implications) before making any investment decisions. Investors should ensure they fully understand the risks associated with the investment products and should also consider their own investment objectives and risk tolerance level. The investment decision is yours. You should not invest unless the intermediary who sells you the investment products has advised you that it is suitable for you and has explained how it is consistent with your investment objectives. Please refer to the relevant offering documents or other legal documents for further details including the risk factors. This website is published by Robeco Hong Kong Limited which is regulated by the Hong Kong Securities and Futures Commission (“SFC”) (CE No. APU851). This website has not been reviewed by the SFC. No assurance can be given that the investment objective of any investment products will be achieved. No representation or promise as to the performance of any investment products or the return on an investment is made. The value of investments may fluctuate. Past performance, projections, or forecasts included in this website should not be regarded as guarantees or indications of future performance, and no express or implied warranty is provided. The contents of this website are based on sources believed to be reliable, but due to the nature of information delivery technology and the necessity of using multiple data sources, including third party content, their accuracy is not guaranteed. The opinions expressed are as of the date shown above and may change as market conditions evolve, and are subject to change without notice. These opinions may differ from those of other Robeco investment professionals. Robeco accepts no liability for any direct, indirect, or consequential loss arising from the use of this material or any comments, opinions, or estimates contained herein. Robeco has no duty to update this website or any website content. Materials on this website may not be reproduced, distributed, or published without prior written permission from Robeco. Unless otherwise specified, Source: Robeco.