Researcher
Active Quant: finding alpha with confidence
Blending data-driven insights, risk control and quant expertise to pursue reliable returns.


Portfolio management is all about trading off expected return and risk. The key ingredient to measuring and managing portfolio risk is the variance-covariance (VCV1) matrix which needs to be estimated for the given investment universe.


At its core, the VCV informs about assets’ riskiness and their inter-dependencies, as measured by their variance and covariance, respectively. The natural candidate to use is the sample covariance matrix; however, this estimator is prone to error and not suitable when the number of assets under consideration is large, as is often the case when optimizing equity portfolios. To this end the academic literature proposes myriad alternative VCV estimators to address these limitations. But how can we best evaluate the practical relevance of a given VCV estimator?
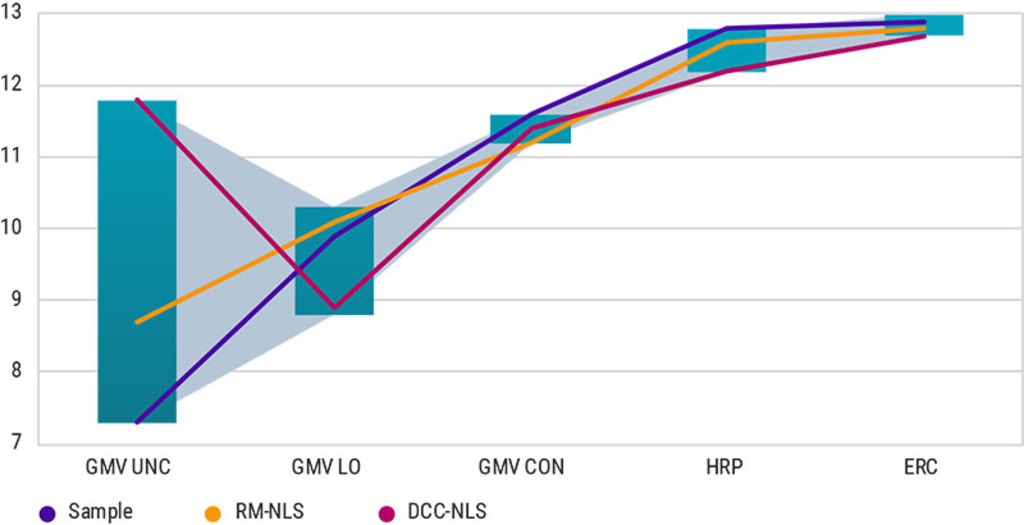
In a recent research paper, quant researchers Clint Howard, Maarten Jansen, Harald Lohre, and M. Sipke Dom set out to answer this question, putting a wide range of alternative VCV estimators to the practical test. Importantly, they challenge the common academic practice of evaluating the relevance of novel VCV estimators using the unconstrained global minimum variance (GMV) portfolio. Indeed, when validating VCV estimators based on the ex-post volatility of this portfolio, the researchers confirm the academic backing for considering shrinkage and covariance dynamics in modelling the VCV for equity portfolio construction.
This is evident in the leftmost bar of the below figure that highlights a wide range of volatility outcomes for unconstrained GMV portfolios that differ only in the choice of underlying VCV estimator. Yet, these portfolios are often impractical due to their high leverage, concentration, turnover, and transaction costs. The researchers therefore investigated how the opportunity set for volatility improvement changes when making the GMV test portfolios more investable. Although long-only constrained GMV portfolios still allow for meaningful volatility improvements, their overly concentrated stock allocation calls for further constraining portfolio weights.

Blending data-driven insights, risk control and quant expertise to pursue reliable returns.
Source: Robeco 2024
Resorting to truly investible GMV portfolios, the researchers reveal a considerably reduced opportunity set for alternative VCV estimators. Similar findings hold for alternative risk-based portfolio construction approaches, such as risk parity portfolios that aim to maximize portfolio diversification.
These findings highlight the discrepancies between the optimal VCV matrix estimator across different portfolios, suggesting that what works best for an unconstrained GMV portfolio may not hold under more realistic conditions with significant investment constraints. Such realistic test portfolios suggest that the overall room for improvement from a given VCV estimator is limited. Nevertheless, statistically significant improvements can still be made under the right circumstances.
Read the full paper on SSRN.
1From Investopedia: ‘Variance refers to the spread of a data set around its mean value, while a covariance refers to the measure of the directional relationship between two random variables… Variance is used by financial experts to measure an asset's volatility, while covariance describes two different investments' returns over a period of time when compared to different variables.’
Subscribe to our newsletter for investment updates and expert analysis.