

Analyst


• 市場觀點
A blueprint for evaluating climate risk in real estate
Real estate has a building problem. Greenhouse gas emissions are rising, putting cash flows and even property assets at risk. Robeco’s sector decarbonization pathway (SDP) model helps investors quantify transition risks and build transition-ready positions in the real estate sector.


概要
- Buildings are energy- and emissions-intensive
- Real estate companies need deep retrofits to meet net-zero targets
- SDP models help investors estimate net-zero risks and opportunities
Cutting emissions in the built environment is critical for reaching the goals of the Paris Agreement. It’s also crucial for reducing physical and transition risks in real estate portfolios. But it’s not all risk and no return – investment opportunities also abound. Robeco’s SDP model is designed to uncover the real estate companies that are the most exposed to risk but also those best positioned to profit from the net-zero transition. To do this the model focuses on four key areas:
Measuring the alignment of company emissions intensities pathways with science-backed benchmarks
Testing the viability and credibility of companies’ planned emission reduction commitments
Estimating the costs and future financial impact of ‘green and clean’ capex investments
Evaluating the shape, speed and impact of regulatory policies and other market forces
Buildings generate nearly 26% of all global GHG operational emissions, making it one of the most emissions-intensive economic sectors.1,2 To reach Paris-aligned climate goals, emissions must plummet (see Figure 1) from current levels. This will be a challenge given the energy inefficiencies and fossil-fuel dependencies of the existing built environment. What’s more, the total floor area is expected to increase by 20% globally in the next decade – more than the existing floor area of North America. Without abatements, emissions will also expand, potentially derailing net-zero efforts to combat climate change.
Figure 1 – Building emissions must plunge to hit net-zero scenario milestones
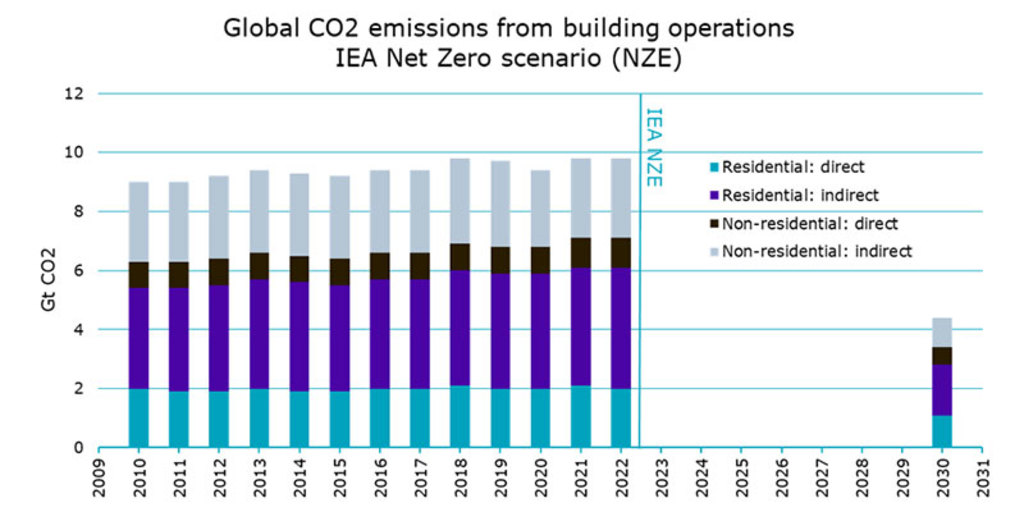
Source: Robeco, IEA. License: CC BY 4.0
More importantly, failure to curb energy use and emissions is intensifying the sector’s exposure to transition risks and even stranded assets as regulatory policies and tenant preferences make emission-intensive properties unattractive. Physical risks are also increasing with the frequency and severity of heat waves, wildfires, and damaging floods in summer and freezing cold snaps in winter that are overwhelming energy grids and building systems. Despite tenant discomfort, the brunt of the damage will be borne by property owners, operators and their insurers.
Figure 2 – Real estate’s exposure to climate risks
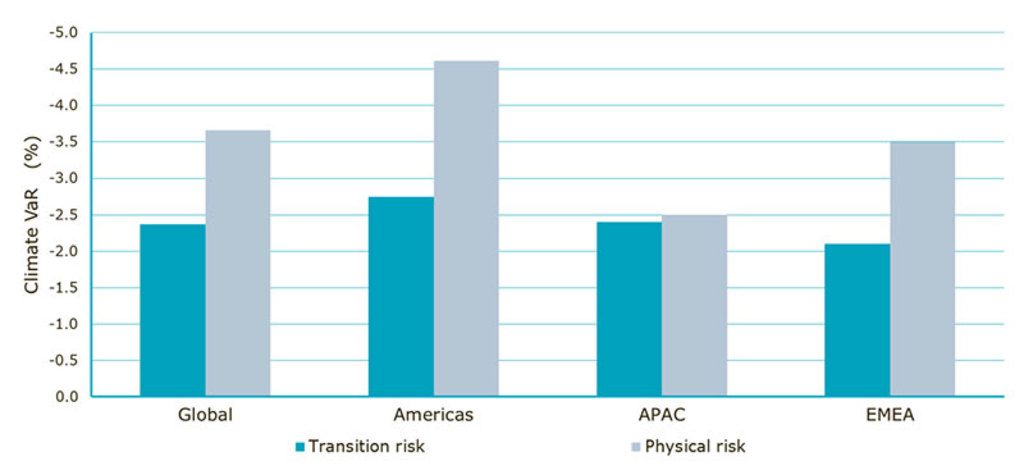
Date for project climate risk in MSCI Global Annual Property Index. Climate risks faced by real estate firms are transitional and physical.
Source: MSCI, 2022, UNEP Sectoral briefings: Climate risks in the real estate sector, March 2023
Measuring emissions alignment with sector benchmarks
The model is focused on listed companies which own or manage real estate assets. It measures company emission performance based on gaps in its alignment with science-backed sector benchmarks. To simplify its application to investment portfolios, we have designed a single decarbonization score for each real estate company assessed. The score, which ranges from 1 to 100 (worst to best), is the culmination of several streams of analyses that measure a company’s past, present and future emissions intensities against internationally accepted and science-backed sector standards (see Figure 3 for an illustrative company example).3
Figure 3 - Estimating the deficits in company carbon trajectories
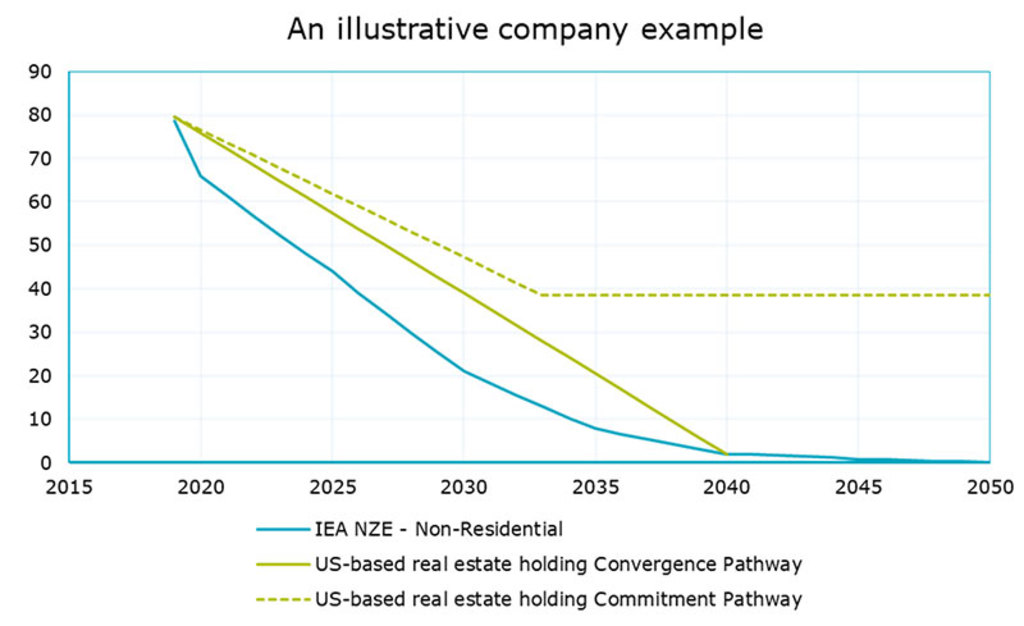
Source: Robeco, IEA, 2023.
Pathways measured in the decarbonization score
The Convergence Pathway – extrapolates an illustrative real estate company’s carbon-emissions trajectory based on emissions intensities measured at baseline year 2019 through 2050, the year in which the IEA and IPCC estimate all real estate sector companies will reach net-zero emissions.
The Commitment Pathway – plots the emission reduction pledges made by real estate companies (here a US-based real estate holding). Company pledges only extend to 2033, so we hold emission targets constant thereafter.
A high decarbonization score could reflect smaller gaps between emission intensity levels and the industry benchmarks and helps identify early leaders with strong decarbonization momentum.
High scores can also mean that companies (even those with high current emissions intensities) realize the work ahead and have committed to reducing those emissions to required levels. Although scores are principally used to compare the decarbonization performance of companies in the real estate sector, they are designed to be comparable across sectors and investment universes.
了解最新的可持續性市場觀點
訂閱我們的電子報,探索塑造可持續投資的趨勢。
Integrating technology investments
Although company emission pledges account for more than half of its decarbonization score, announcements don’t equal execution. And committed capex is ultimately what counts. The IEA estimates over USD 570 billion in energy-efficiency investments are needed annually through 2030 to align with net-zero climate scenarios.
We therefore use a company’s capital expenditures on decarbonization technologies to measure the credibility of its pledges as well as to estimate the potential impact of ‘green upgrades’ on the bottom line. In order to simplify technology cost calculations and apply the model on a global scale, we assume all buildings will, to some extent, undergo deep energy retrofits4 which include:
Re-insulation of the exterior walls, foundations, roofs, windows, and doors
Replacement of fossil-fuel HVAC systems with all-electric models
Sensor-based lighting and appliances to reduce energy use
Installation of energy-efficient water heating
We estimate the magnitude of upgrade investments needed based on a company’s current energy intensity - if it is far above benchmark, larger retrofits will be needed.5 Larger upgrade costs could negatively impact a company’s future cash flows and stock price performance. Moreover, when estimates for retrofits don’t match the company’s planned capex for property upgrades, it signals a red flag, which casts doubt on the company’s capacity to achieve its decarbonization goals.
When estimates for retrofits don’t match the company’s planned capex for property upgrades, it signals a red flag
Policy changes and market dynamics
EU countries are farthest along in regulatory planning – frameworks range from building energy codes and minimum performance standards to stipulations on solar energy installations. But regulations in both the EU and in jurisdictions globally are spread too thinly over different mechanisms to have an appreciable impact. And policy variations between municipalities also complicate the analysis. We therefore do not calculate policy costs in the model.
While the push from regulators will intensify as countries honor their net zero commitments, the pull to decarbonize is presently stronger from tenants. This should push property owners towards deep retrofit upgrades in the short- to mid-term. First, demand for certified sustainable space, which is not only less polluting but also more energy- and cost-efficient to operate, is picking up. Second, greener structures enable commercial tenants and building owners to meet their own operational emission targets. Property owners are increasingly forced to renovate simply to attract and retain more lucrative occupants. For this reason, our analysis considers capex costs for green retrofits as more financially material for real estate companies than the impact of regulations or fines at present.
While the push from regulators will intensify … the pull to decarbonize is presently stronger from tenants
Opportunities don’t stop with customers; renewable energy generated onsite not only lowers a property’s energy costs, but also provides profit opportunities as excess solar power is sold back to the utility. Moreover, over the medium- to long-term, a bigger risk is looming. As sustainable buildings become the new normal, buildings which have not been upgraded to meet sustainability standards are likely to become stranded or impaired assets – generating zero to negative value.
Finally, there is too much data variation and too little transparency in many areas. This means generalized assumptions were applied to make analyses efficient and the model scalable across real estate companies globally. Those assumptions will be refined as more data becomes available. In the meantime, estimates should still provide insights that inform investment teams of the material risks associated with decarbonization and the net zero transition in the real estate sector.
Footnotes
1 GHG emissions can be operational, created by burning energy for building maintenance and occupants’ energy consumption. They can also be embodied, emissions generated when the building’s materials (e.g., cement, steel) are created, during its construction, as well as in its renovation or destruction. The SDP analysis only includes operational emissions due to limited data on embodied emissions reported from companies.
2 IEA, see https://www.iea.org/energy-system/buildings#tracking
3 We compared company performance with several universally recognized benchmarks including the Carbon Risk Real Estate Monitor’s Global 1.5°C (CRREM) and the IEA Net-zero by 2050 Scenario (IEA NZE). Company data is sourced from the GRESB (Global Real Estate Sustainability Benchmark), a leading provider of real estate industry data and ESG benchmarking services, or from companies’ annual reports. Additional data on company emission targets has been sourced from CDP, SBTi as well as from companies’ sustainability reports.
4 We simplify calculations by assuming an overall cost per square meter of a deep energy retrofit instead of making separate assumptions for re-insulation costs, HVAC, or other building system upgrades. Please see “The impact of deep energy retrofit costs on the real estate sector.” Robeco. March 2022. Available on Robeco’s global website.
5 Variations in property types will influence renovation costs – for example, warehouses will need less extensive upgrades than hospitals. Therefore, we group properties by building-use/type and calculate the retrofitting costs for each company based on the excess level of energy intensities relative to the sector benchmark. Retrofit costs for property types are based on industry research, “The impact of deep energy retrofit costs on the real estate sector.” Robeco. March 2022.
Important information
The contents of this document have not been reviewed by the Securities and Futures Commission ("SFC") in Hong Kong. If you are in any doubt about any of the contents of this document, you should obtain independent professional advice. This document has been distributed by Robeco Hong Kong Limited (‘Robeco’). Robeco is regulated by the SFC in Hong Kong. This document has been prepared on a confidential basis solely for the recipient and is for information purposes only. Any reproduction or distribution of this documentation, in whole or in part, or the disclosure of its contents, without the prior written consent of Robeco, is prohibited. By accepting this documentation, the recipient agrees to the foregoing This document is intended to provide the reader with information on Robeco’s specific capabilities, but does not constitute a recommendation to buy or sell certain securities or investment products. Investment decisions should only be based on the relevant prospectus and on thorough financial, fiscal and legal advice. Please refer to the relevant offering documents for details including the risk factors before making any investment decisions. The contents of this document are based upon sources of information believed to be reliable. This document is not intended for distribution to or use by any person or entity in any jurisdiction or country where such distribution or use would be contrary to local law or regulation. Investment Involves risks. Historical returns are provided for illustrative purposes only and do not necessarily reflect Robeco’s expectations for the future. The value of your investments may fluctuate. Past performance is no indication of current or future performance.