Chief Researcher


• 研究
Shrunk betas can fortify Low-risk portfolios
Research shows that beta forecasts are improved by shrinking correlations more than relative volatilities. In turn, these superior estimates can be used in low-risk portfolios to enhance their risk-return outcomes.
作者




Head of Conservative Equities and Chief Quant Strategist

Head of Solutions Research

Researcher
概要
- Accuracy of beta forecasts can be improved by shrinking correlations more than volatilities
- Asymmetric beta shrinkage results in portfolios with lower risk and higher alpha
- But sorting stocks on volatility and beta is a simpler alternative, with similar results
In the capital asset pricing model (CAPM), beta is used to describe how the returns of a particular stock (or portfolio) are related to those of the market. It is defined as the correlation between a specific stock (or portfolio) and the market, multiplied by the relative volatility of the stock (or portfolio) versus the market.
Beta is, however, an unobserved characteristic that needs to be estimated. Thus, finding the best way to forecast the beta of securities is an important consideration for academics and practitioners. But more importantly, dealing with the accompanying estimation error is a crucial step in the process. Robeco researchers tackled these issues in an academic paper1 that focused on beta estimations using shrinkage techniques, by looking at the US stock market from January 1963 to December 2017.
For the study, the authors assumed that correlations and relative volatilities are independent of each other, such that beta expectations are equal to the product of these two estimated components. To examine which approach best forecasts beta, they analyzed a range of methods, from those that shrink the beta in its entirety, to others that reduce estimation errors in correlations and relative volatilities to their cross-sectional averages separately.
To investigate the effect of implementing shrinkage on correlations and relative volatilities, they looked at the resulting mean squared errors (MSE) of the beta estimates when correlations and relative volatilities were shrunk at different levels. This ranged from a shrinkage factor of 0 to 1 for both parameters.
The analysis confirmed that the largest estimation error – or highest MSE – occurred when no shrinkage was implemented. Meanwhile, a two-parameter approach – that reduced correlations (0.5 shrinkage factor) more than relative volatilities (0.2 shrinkage factor) – produced the best outcome (or lowest MSE). Moreover, one-parameter settings generally delivered suboptimal results.
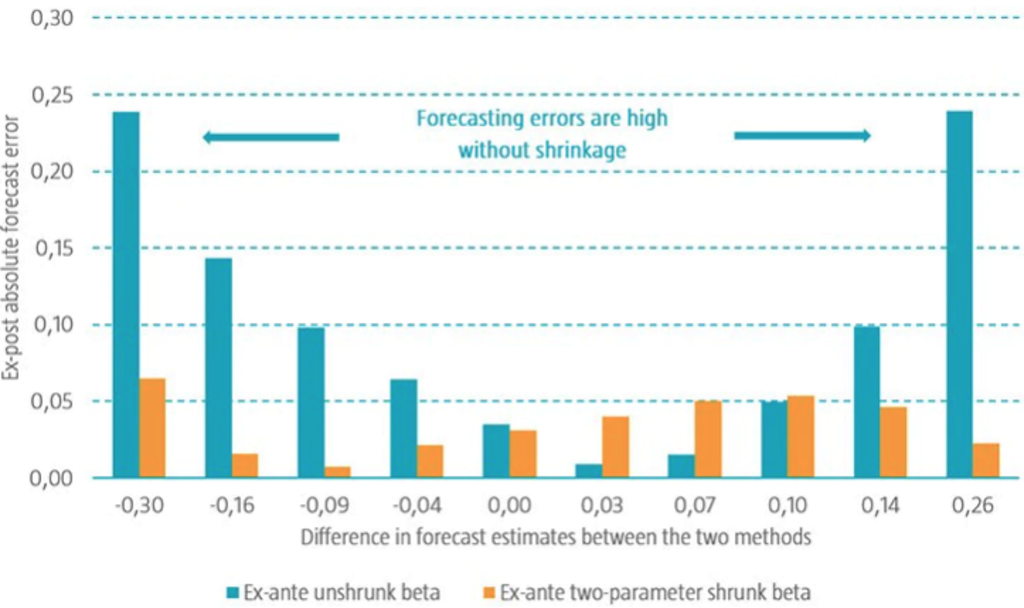
The researchers also scrutinized stocks that had the most dissimilar beta predictions when the no shrinkage and two-parameter shrinkage approaches were applied. This comparison was also made between the related estimates of the one-parameter shrinkage and two-parameter shrinkage settings. Thereafter, the stocks were ranked on the differences in beta forecasts between these methods and allocated to 10-decile portfolios. The average ex-ante beta estimates for these portfolios were then compared with their realized betas over the full sample period.
The results revealed that the two-parameter shrinkage method had lower forecasting errors than the other two approaches. Indeed, Figure 1 shows the ex-post absolute beta forecast error for both the no shrinkage and two-parameter shrinkage settings for each of the 10-decile portfolios, while the horizontal axis reflects the differences in ex-ante average beta estimates between the two methods.
Figure 1 | Decile portfolios sorted on beta estimate differences between no shrinkage and two-parameter shrinkage methods
Source: Blitz, D., Swinkels, L., Ūsaitė, K., and Van Vliet, P., December 2021, “Shrinking beta”, SSRN working paper.
Improved ex-ante beta estimates at the individual stock level led to lower ex-post portfolio betas
Shrunk betas result in less risky portfolios
The authors also assessed whether these improved ex-ante beta estimates at the individual stock level led to lower ex-post portfolio betas. They ranked stocks on their historical beta estimates and allocated them to 10-decile portfolios. The same exercise was performed using the two-parameter shrinkage beta forecasts. In addition, a long-short strategy based on a long position in the D1 portfolio (lowest beta estimates) and short position in D10 portfolio (highest beta estimates) was constructed.
For the strategies based on historical beta estimates, the results showed that the D1 portfolio had an average excess return of 7.26%, volatility of 11.04%, Sharpe ratio of 0.66, and market beta of 0.45. On the other hand, the D10 portfolio also had an average return of 7.26%, but a volatility of 32.59%, Sharpe ratio of 0.22, and a market beta of 1.65. Meanwhile, the long-short portfolio exhibited an alpha of 10.14% relative to the CAPM.
For the strategies based on the two-parameter shrinkage beta estimates, the D1 portfolio had a lower ex-post beta (from 0.45 to 0.42) and a lower realized volatility (from 11.04% to 10.79%). In addition, the D10 portfolio had a higher volatility and a higher ex-post beta. This also indicates that risk can be better predicted on an overall portfolio level. Finally, the long-short portfolio delivered a CAPM alpha that was almost 2% higher (from 10.14% to 11.87%) and that was statistically significant.
Comparing low beta and Low Volatility portfolios
In their paper, the researchers found that beta predictions were more accurate when correlations were shrunk more to their cross-sectional average than relative volatilities. For portfolio construction purposes, these results could be seen as a reason to allocate less weight to estimated correlations than forecasted relative volatilities. To assess this notion, the authors took a different approach and formed portfolios based on either two-parameter shrunk betas, volatility, or a combination of these two variables. This analysis gave them insight on the effect of including correlations alongside volatilities, thereby connecting the literature of low beta and low volatility investing.
When different portfolio combinations based on shrunk beta estimates and volatilities were evaluated, the results revealed that including correlation significantly reduced the volatility of a low-risk portfolio. Therefore, this indicates that correlation is indeed an important element to consider within a low volatility portfolio.
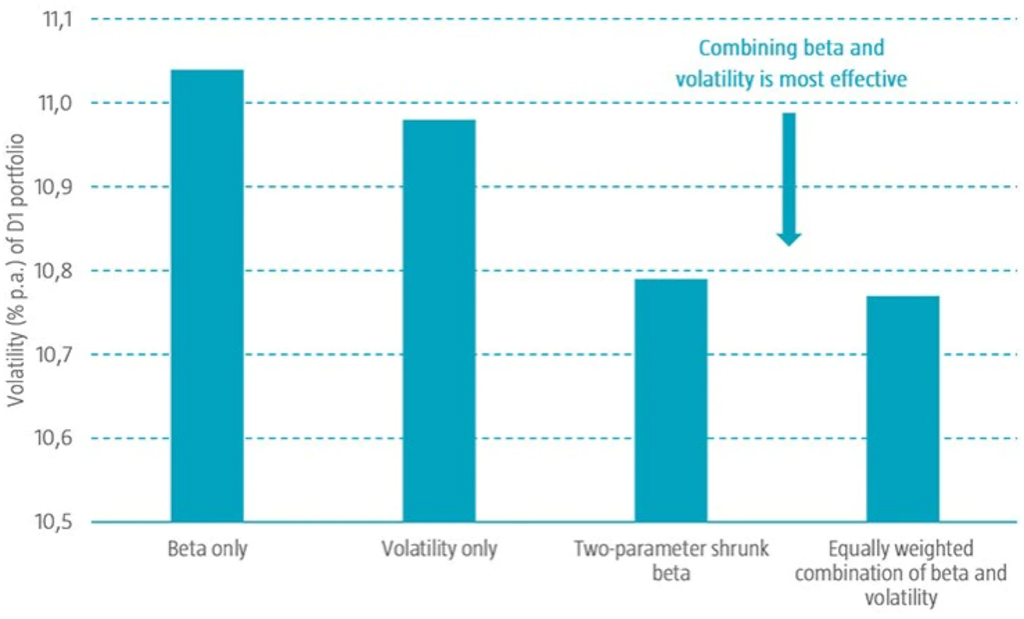
An equally weighted combination of unshrunk betas and volatility are most effective in reducing volatility
However, sorting stocks into portfolios based on their conventional betas gives too much weight to the correlation, which is less accurately forecasted. This can be reduced, however, by shrinking correlations more to their cross-sectional average than volatilities, or by combining conventional betas with pure volatility estimates. This latter approach of equally combining beta and volatility is less complex because there is no need to estimate shrinkage parameters.
This concept is illustrated in Figure 2, which shows that the portfolios based only on conventional beta exhibit the highest realized volatility. Furthermore, it depicts that standalone volatility is a better predictor than standalone beta. Meanwhile, those that are based on two-parameter shrunk betas or use an equally weighted combination of unshrunk betas and volatility are most effective in reducing volatility.
Figure 2 | Comparing the realized volatilities of portfolios based on four different construction methods
Source: Blitz, D., Swinkels, L., Ūsaitė, K., and Van Vliet, P., December 2021, “Shrinking beta”, SSRN working paper.
All in all, the results from this research paper indicate that correlations can help enhance the risk-return outcomes of low-risk portfolios. But since they are less accurately estimated than volatilities, they should be handled with care.
Footnote
1Blitz, D., Swinkels, L., Ūsaitė, K., and Van Vliet, P., December 2021, “Shrinking beta”, SSRN working paper.
重要資料
本網站僅供《證券及期貨條例》(香港法例第571章)及其附屬法例所界定之專業投資者瀏覽及使用。 投資涉及風險。過往表現並不代表未來表現。本網站所載資料僅供參考之用,並不構成任何投資建議,亦非作出買賣任何證券或採納任何投資策略之要約或招攬。投資者不應僅憑本網站提供之資料作出投資決定,在作出任何投資決定前,應徵詢獨立意見(包括有關稅務影響之意見)。投資者應確保完全理解投資產品的相關風險,亦應考量自身投資目標及風險承受水平。投資乃閣下之個人決定。除非銷售投資產品的中介人已向閣下告知該投資產品適合閣下,並已解釋其符合閣下投資目標之原因,否則閣下不應投資。請參閱相關發售文件或其他法律文件,以獲取包括風險因素在內的進一步詳情。 本網站由荷寶投資管理香港有限公司發布,該公司受香港證券及期貨事務監察委員會(「證監會」)規管(中央編號:APU851)。本網站未經證監會審閱。 無法保證任何投資產品可實現其投資目標。概不就任何投資產品之表現或投資回報作任何聲明或承諾。投資的價值或會波動。本網站所載過往表現、推算或預測,均不應視作未來表現之保證或指標,且概不提供任何明示或暗示之保證。本網站內容建基於相信為可靠之來源,惟因應資料傳遞技術特性及須採用多項數據來源(包括第三方內容),故概不保證其準確性。所述觀點僅乃截至上述日期,或會隨市況變化而改變,可予更改而毋須另行通知。該等意見可能有別於其他荷寶投資專業人士之意見。因使用本材料或當中所載任何評論、意見或估算而引致之直接、間接或相應損失,荷寶概不承擔法律責任。荷寶並無責任更新本網站或任何網站內容。未經荷寶事先書面許可,不得複製、分發或刊發本網站任何材料。 除非另有說明,資料來源:荷寶。