Quantitative investing
Gradient descent (GD) is the cornerstone of many optimization algorithms. It is used to find a local minimum of a differentiable function, taking steps proportional to the negative of the gradient of the function at the current point. GD is an iterative algorithm that improves its output step after step and can therefore be used to update the parameters of a model.
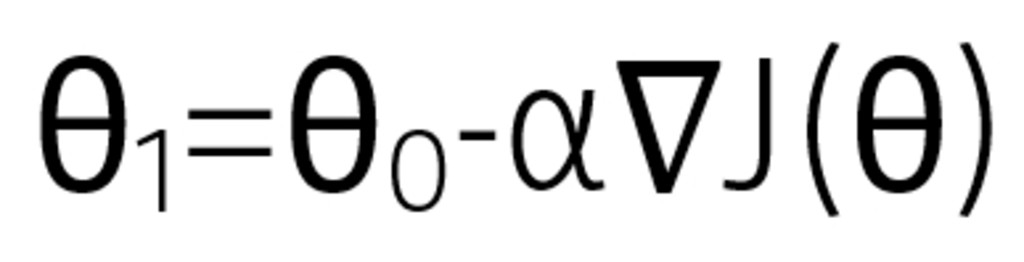
Where
θ0: current position
θ1: next position
α: small step (or step size)
∇J(θ): fastest direction increase
To use an analogy, imagine a hiker (the algorithm) lost atop a hill (the function) in foggy weather, trying to get down as quickly as possible. To avoid wasting time, the hiker needs to walk downwards in the direction where the slope is the steepest. The hiker has an instrument (the gradient) to assess steepness, but, this tool is not very handy and requires stopping each time to make the measurement. The hiker thus tries to limit using this tool.
At the start of the decent, the slope is very steep and hiker can walk long stretches (steps) without stopping for measurement. But as the destination gets closer, measurements become more frequent, to avoid missing the bottom. Using this method, the hiker eventually reaches the bottom (local minimum), assuming he or she avoids getting stuck in a local obstacle, like a mountain lake, for example.
GD is one of the most common techniques used in machine learning (ML). Some even argue ML is nothing more than GD on a function with thousands of parameters. ML is about using empirical data to refine a model – for example, an asset pricing model – to minimize discrepancies between model results and reality (the function), and then making predictions with the refined model.
Quantitative investment strategies increasingly involve analyzing large, complex and disparate datasets, that are difficult – or even impossible – to specify with traditional financial models, which rely on closed form solutions. In this context, ML methods, using tools such as GD, can turn out to be more useful than standard, widely used statistical techniques.
One example is the use of ML to analyze financial text data, such as regulatory filings, earnings releases or news articles. While the capacity of traditional techniques to extract relevant signals from text remains limited,1 interesting results regarding stock-price forecasting applying ML on financial news have been reported and represent a promising area for future research.

Nieuwe generatie quantoplossingen
De technologische vooruitgang levert ook nieuwe mogelijkheden op voor kwantitatieve beleggers. Het gebruik van meer data en de inzet van geavanceerde modelleringstechnieken stellen ons in staat om tot betere inzichten te komen en onze besluitvorming te verbeteren.
Footnote
1 These are mainly techniques based on bag-of-words, noun phrase and/or named entity feature extraction combined with manual feature selection. With these techniques, however, much of the structure of the text is lost.
See also