Climate Data Scientist


• SI Debate
SI Debate: Climate investing after one year of Trump
Since the 2015 Paris Agreement put climate commitments on the global agenda, a new interesting question for investors, policymakers, and academics has arisen: are green companies outperforming their brown, high emitting counterparts? While comparing clean versus dirty sounds like a simple comparison, a surprisingly tangled financial story about expectations, risk, politics, and the price of capital lies underneath.
Authors


Head of Solutions Research
Top keywords
Summary
- Second Trump term has changed the landscape for climate investing
- US policy reversals gave brown companies in the US a returns boost
- Climate leaders still outperform laggards, reflecting earnings potential
At first glance, the idea seems intuitive. If the world is becoming more concerned about global warming and starts embracing the clean energy transition, low carbon businesses should enjoy better growth prospects. And indeed, one reason why green stocks might have outperformed brown ones is straightforward: earnings expectations.
Investors may have underestimated how fast green technologies would grow and how strongly demand would change. When profit forecasts were revised upward, share prices rose as a result. Brown companies, like oil producers, coal miners and heavy industrial emitters, might have seen fewer positive surprises.
But there’s another, subtler mechanism at work; one that gets far less attention outside the classroom – the cost of capital. This is essentially the expected return that investors demand for holding a company’s shares. If that expected return rises, the share price falls, even if the company’s business stays the same.
And this is exactly where climate policy enters the picture. When large institutional investors divest from fossil fuel-heavy industries, they often justify this not only on moral grounds, but also due to risk. Carbon-intensive firms face stricter regulation, stranded assets, volatile demand and future liabilities.
When large institutional investors divest from fossil fuel-heavy industries, they often justify this not only on moral grounds, but also due to risk
These risks mean brown companies should have a higher cost of capital. As investors move out, share prices are pushed down, which increases expected returns.
In other words, brown stocks can lag simply because the market becomes less willing to own them, and not necessarily because their earnings are disappointing. Ironically, once that higher cost of capital is fully priced in, theory predicts the opposite effect: brown companies should eventually earn higher returns, compensating investors for their elevated climate risk. This is what some researchers term the carbon risk premium.
Global Climate Transition Equities I EUR
- performance ytd (31-5)
- 15.18%
- Performance 3y (31-5)
- 17.97%
- morningstar (31-5)
- SFDR (31-5)
- Article 8
- Dividend Paying (31-5)
- No
Past performance is no guarantee of future results. The value of the investments may fluctuate. Annualized (for periods longer than one year). Performances are net of fees and based on transaction prices.
So what’s been happening in reality?
To find out, researchers have built increasingly sophisticated models linking stock prices to long term growth expectations and the changing cost of capital. When we estimate these models and check the outcomes, a clear picture begins to emerge.
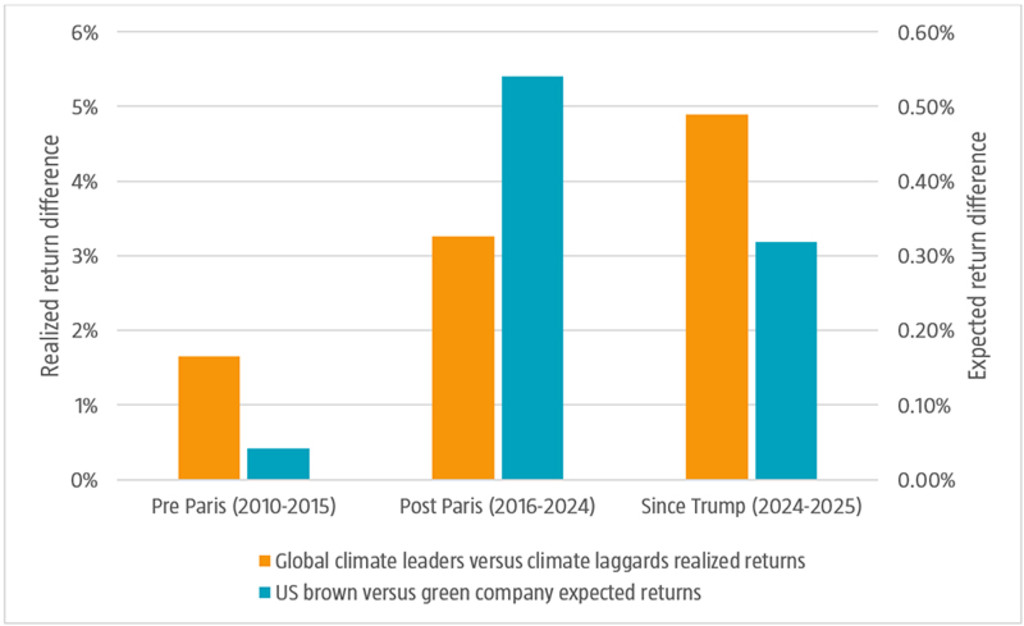
Figure 1: The expected versus realized returns paradox
Past performance is no guarantee of future results. The value of your investments may fluctuate. For illustrative purposes only.
Source: Robeco, Markwat, Hanauer, Swinkels (2026).
In the US, in the years immediately after the Paris Agreement, the cost of capital or expected return for brown companies rose by 0.55 percentage points compared to similar green companies. The latter are the one-third of companies within each industry with the lowest carbon emission intensity; brown companies are the one-third with the highest.
This is shown by the blue bars in the chart above. This is a meaningful repricing in financial markets. And notably, this 0.55 percentage point difference between brown and green stocks stayed more or less the same until the US presidential election in November 2024.
Trump 2.0: Rolling back the rules
Then politics shifted. Climate rules were rolled back, the US left the Paris Agreement, and subsidies for clean energy were reduced. Pressure on polluting companies eased, and investors reacted in the same way. Although Trump also withdrew from the Paris Agreement during his first term, the backtracking on climate policies has been much more aggressive in his second term.
The gap in the cost of capital between brown and green companies has since narrowed by dropping to 0.30 percentage points. For investors in brown stocks, this was good news. A lower cost of capital automatically raises valuations. In effect, US policy reversals gave the brown carbon intensive companies in the US a returns boost.
Climate leaders versus laggards
At Robeco, we do not like the distinction between green and brown companies so much. Instead, we assess whether companies have credible plans to decarbonize their businesses, or develop new technologies to accelerate the transition to clean energy. Those with good plans we label ‘climate leaders’ and those without we call ‘climate laggards’.
Even as US climate commitments weakened, global climate leader companies experienced improving earnings prospects
While there is a substantial overlap between the two, the distinction is important, as some brown companies are credibly transitioning to become green. But what about these climate leaders, these green or greening firms that were supposed to suffer from these policy reversals? Have they been punished for doing the ’right’ thing?
The data suggest the opposite. Even as US climate commitments weakened, global climate leader companies experienced improving earnings prospects, driven by technological momentum, falling clean energy costs, and accelerating adoption of climate-friendly policies in Europe and Asia. This is shown by the orange bars in the chart. Those upward profit revisions translated into higher stock prices regardless of US policy drift.
Has it paid off?
So, has going green paid off? It depends on how you measure it. Brown companies in the US got a short-term boost when US climate policies pulled back. But global climate leader companies are still seeing better-than-expected growth.
One thing is clear: the post Paris market story is far more nuanced than a simple win for clean energy. It’s about shifting expectations, geopolitical reversals, repriced risks, and a reminder that in financial markets, climate change is no longer an abstract future threat. It’s already moving prices today.