Client Portfolio Manager


• Insight
Why emerging markets are back in focus
Emerging markets (EM) are stepping into the spotlight as developed economies grapple with volatility and policy uncertainty. With global dynamics shifting, EMs are showing strength across asset classes, and active investors are taking notice.
Authors

Meena Santhosh


Client Portfolio Manager

Head of Fixed Income Asia
Summary
- Emerging markets are outperforming developed markets across asset classes
- Global structural shifts are reshaping the financial order
- Turning complexity into opportunity in emerging markets requires active management
The global market shake up over the past two months has been revealing. US exceptionalism is fading and long-held relationships like the correlation between a strong dollar and lower Treasury yields have faltered. Central banks are struggling with persistent uncertainty created by tariffs and the Fed faces a difficult trade-off: managing tariff-induced inflation versus supporting weakening growth.
Against this backdrop, structural shifts in the global economy coupled with geopolitical conflict, trade fragmentation and fiscal pressures, are challenging traditional investment approaches. Despite global trade tensions, emerging markets are benefiting from easing inflation, improved balance sheets, and a weaker US dollar – conditions that support more accommodative monetary policies.
With growing uncertainty around US policies, diversification has become essential. Portfolio reallocations away from the US already appear to be underway, as investors adopt a more selective global perspective to maintain resilient portfolios.
Emerging markets, by contrast, are now in a cyclically strong position, having moved past their post-Covid defaults – a challenge still prevalent in developed market credit. Far from being defined by volatility and political risk, they have shown resilience, outperforming developed markets during this turmoil. Year to date, in the EM bond market, corporates have outperformed US high yield and global investment grade, offering higher returns for similar or better credit ratings. EM debt has exhibited less volatility than US high yield, while offering more yield and wider spreads than investment grade. Similarly, in the equity market, the MSCI EM equities have returned 7.4% (see Figure 2), outperforming US equities and global indices, highlighting their resilience in a volatile macro landscape.1
What’s behind the rise of emerging markets in both equity and fixed income? Structural changes in trade flows, monetary independence, and internal resilience are transforming EM from a cyclical trade into a strategic allocation.
Figure 1 - EM bonds have outperformed in 2025
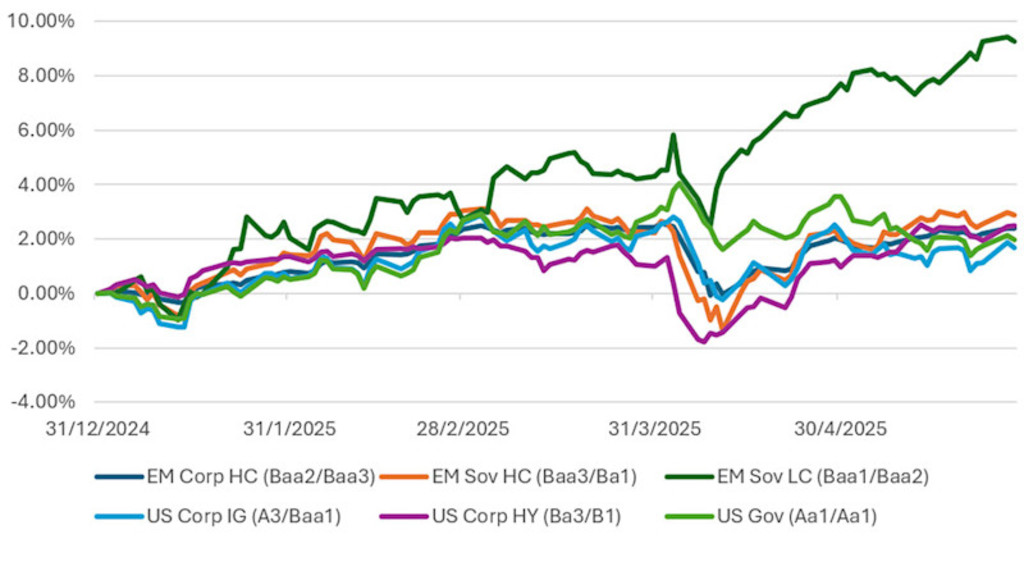
Source: Bloomberg, Robeco, May 2025.
Past performance is no guarantee of future results. The value of your investments may fluctuate.
Figure 2 - MSCI EM equities have outperformed in 2025
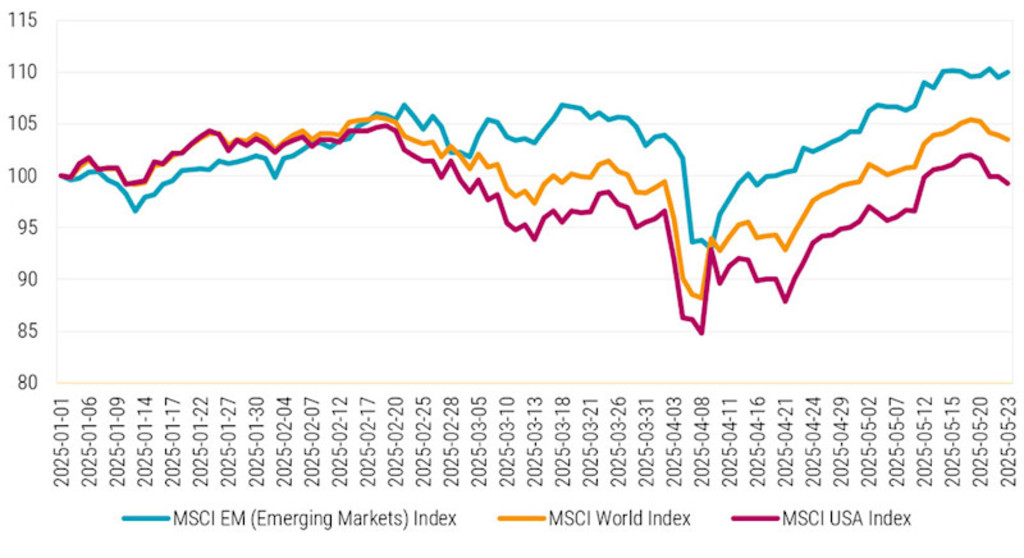
Source: MSCI to 23 May 2025.
Past performance is no guarantee of future results. The value of your investments may fluctuate.
Emerging markets take the lead in trade and growth
The US remains an important economic force, but its dominance as an export destination for emerging markets has structurally declined, shifting from 20% in 2000 to 14% today. Meanwhile, EM exports have surged by over 460% (see Figure 3). This has been driven by intra-regional trade, the rise of large Asian emerging economies, and EM-led global value chains. Trump’s new round of trade negotiations is likely to accelerate the importance of emerging markets as export and trade hubs. At the same time, we’ve seen a decline in US consumer dominance and a rise in consumer demand across emerging markets, particularly in countries like China.
Figure 3 - EM global exports (USD, trillion) are playing a bigger role in EM growth
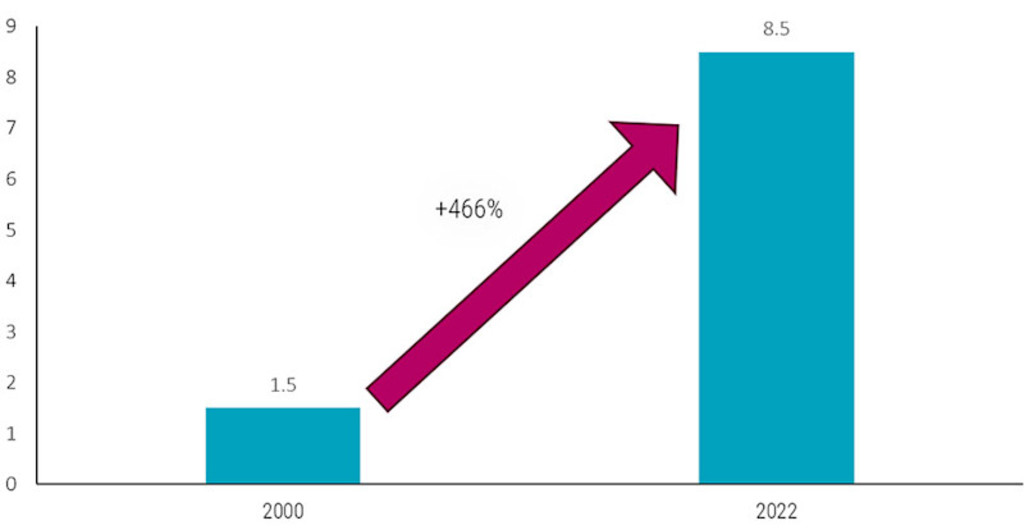
Source: Robeco, World Bank data as of end December 2024.
The growth gap between EM and DM is widening
EMs have outgrown DMs for decades, but returns haven’t always followed. This time, more resilient fundamentals and greater monetary autonomy could change that. With developed economies facing headwinds, such as lingering inflation, housing market dysfunction and consumer stress, growth is shifting toward emerging economies. The IMF’s April 2025 forecast2 now sees advanced economy growth at just 1.4%, with the US at 1.8% amid rising uncertainty. In contrast, emerging markets are expected to grow 3.7% in 2025, with only modest downward revisions for countries most impacted by trade measures.
In particular, strong growth is anticipated for India, ASEAN and the Middle East. The more positive projections can be attributed to the healthy balance sheets many EM economies possess with low debt levels. Aside from China, EM debt represents just 25% of outstanding world debt.3 A split from the US in setting monetary policy has also shaped EM economies, with many countries staying ahead of the curve in recent years, often entering easing cycles before the Fed. Together, these factors suggest that EM’s structural strength and growth may now be more likely to translate into investment performance than in the past.
Figure 4 - GDP growth in emerging markets
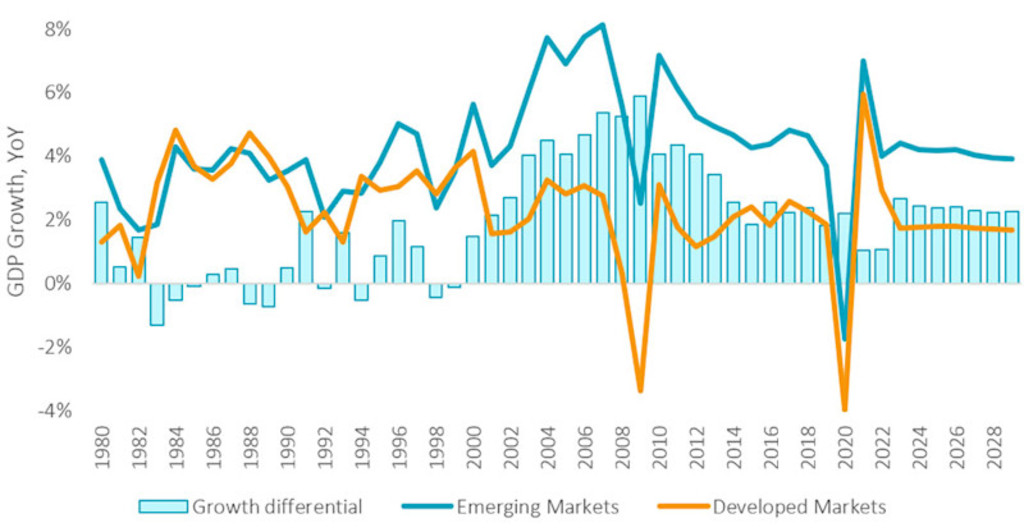
Source: World Bank, IMF, April 2025.
Past performance is no guarantee of future results. The value of your investments may fluctuate.
Emerging markets reshape the financial order
Earnings growth further supports EM’s structural appeal. EM companies are expected to post double-digit earnings growth through 2026, outpacing both the US and broader developed markets. This strong outlook emphasizes the maturity of many emerging market economies.
Figure 5 - Projected earnings growth for EM in 2025 and 2026
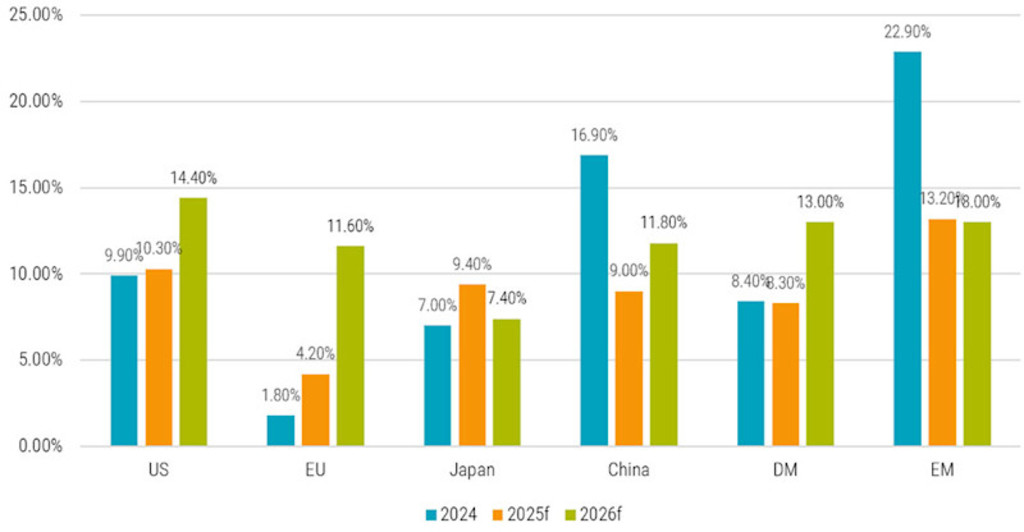
Source: MSCI, IBES, 30 April 2025.
This graph is for illustrative purposes only.
Asia's large surpluses make it a formidable investor
Some of the financial power within emerging markets is already becoming apparent. Since 2010, 12 key Asian economies have accumulated more than USD 8.5 trillion in current account surpluses. Yet only a fraction of that, USD 2.3 trillion, has been held in official foreign exchange reserves. The remaining surplus is increasingly in the hands of private sector entities and is being actively invested outside the traditional reserve channels like US Treasuries. While the US continues to be the world’s largest net borrower, many Asian economies are still among its biggest lenders.
There are some interesting shifts underway. Although US public debt keeps climbing, it’s now largely funded by private investors rather than official institutions like central banks and sovereign wealth funds. At the same time, Asian investors have reduced their share of US Treasury holdings, which have either remained flat or declined. In contrast, their exposure to US equities has grown notably from just over 2% to nearly 7% in recent years.4 This changing investment behavior could have important implications. A shift could impact both US markets and Asia’s financial landscape, with a repatriation of capital strengthening Asian bond market fundamentals and boosting IPO activity across the region.
Selecting the best opportunities across regions and asset classes
A common misconception is to view emerging markets as a single, uniform block. In reality, EM is one of the most diverse investment universes. Regional growth drivers differ significantly: India and ASEAN benefit from strong domestic demand and digitalization, while Latin America is more cyclical, with exposure to commodities and attractive real yields. EMEA markets, meanwhile, are shaped by geopolitical dynamics and reform pathways. This diversity extends across asset classes too. Equities can offer exposure to structural growth, while EM debt, both sovereign and corporate, can deliver attractive yields and diversification, with different roles depending on market cycles.
Robeco’s active approach is built for complexity
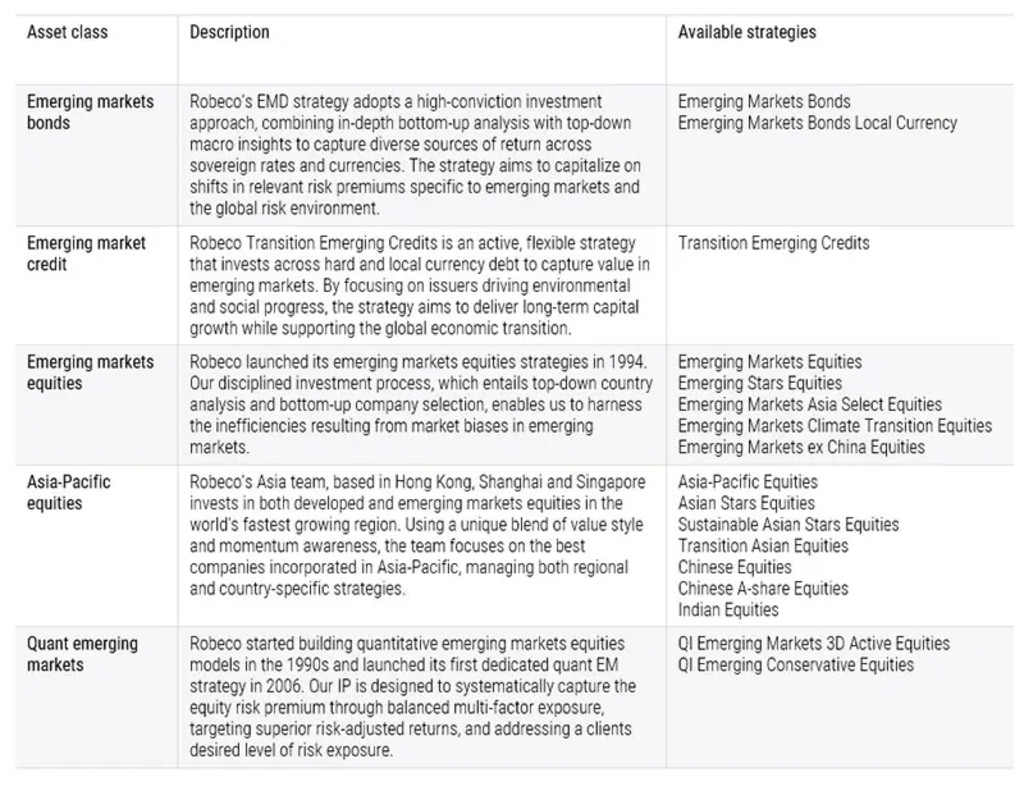
In such a varied landscape, an active investment approach is crucial. Finding value in diverse economies requires local insights and disciplined research and the flexibility to adjust to market conditions and diverging economic policy. Robeco’s broad range of emerging market strategies are designed to manage this complexity and target the best opportunities.
Table 1 - Robeco’s EM strategies span sovereign and corporate debt as well as equities

Discover emerging opportunities
For investors focused on long-term investing with real diversification, EM exposure is critical.
Footnotes
1Past performance is no guarantee of future results. The value of your investments may fluctuate.
2See: https://www.imf.org/en/Publications/WEO/Issues/2025/04/22/world-economic-outlook-april-2025
3BofA Global Research, BIS, Bloomberg. “Size and Structure of Global Emerging Markets Tradable Debt.” As of July 1, 2024
4Asian ownership of US equities US Treasury, CEIC, HSBC
Important information
This information is for informational purposes only and should not be construed as an offer to sell or an invitation to buy any securities or products, nor as investment advice or recommendation. The contents of this document have not been reviewed by the Monetary Authority of Singapore (“MAS”). Robeco Singapore Private Limited holds a capital markets services license for fund management issued by the MAS and is subject to certain clientele restrictions under such license. An investment will involve a high degree of risk, and you should consider carefully whether an investment is suitable for you.