Robeco, The Investments Engineers
  • Careers
  • Contact
  • Media
Global
Europe
Belgique (FR)
België (NL)
Deutschland
España
France
Italia
Nederland
Schweiz (DE)
Switzerland (EN)
United Kingdom
Other countries
Asia-Pacific
Australia
上海 (CN)
Hong Kong (EN)
香港 (ZH)
日本 (JP)
Singapore
Americas
América Latina (ES)
Latin America (EN)
United States
Africa & Middle East
Africa
Middle East
blue circle
Robeco, The Investments Engineers
  • Insights
    • Latest
    • Top stories
    • Market view & outlook
    • Education
    • Webinars
  • Products
    • Funds
    • Strategies
    • Opportunities
  • Sustainable investing
    • Journey
    • Expertise
    • Influence
    • Climate & Biodiversity
    • SDGs
  • About us
    • Who we are
    • Key strengths
    • Diversity & inclusion
    • Contact
Europe
Belgique (FR)
België (NL)
Deutschland
España
France
Italia
Nederland
Schweiz (DE)
Switzerland (EN)
United Kingdom
Other countries
Asia-Pacific
Australia
上海 (CN)
Hong Kong (EN)
香港 (ZH)
日本 (JP)
Singapore
Americas
América Latina (ES)
Latin America (EN)
United States
Africa & Middle East
Africa
Middle East
loader
Contact us

RobecoSAM Smart Energy Equities D USD

Pole position in the clean energy race

Contact us

Share classes

Share classes

Every share class of a product invests in the same portfolio of securities and has the same investment objectives and policies. However, their parameters might deviate. For instance and amongst others, their distribution type, currency exposure or fees and expenses might differ. The most common share classes at Robeco are:
a) D/DH shares, which are regular shares and available for all Investors;
b) I/IH shares, for institutional investors as defined from time to time by the Luxembourg supervisory authority.
For more information on share classes please go to the prospectus.

D-USD

D-CHF

D-EUR

DH-EUR

E-EUR

F-CHF

F-EUR

F-USD

G-GBP

I-CHF

I-EUR

I-GBP

I-USD

IE-EUR

M2-EUR

X-CHF

X-EUR

X-GBP

X-USD

Z-EUR

Z-GBP

Z-USD

Class and codes

Asset class:

Equities

ISIN:

LU2145461914

Bloomberg:

RSSEEDU LX

Index

MSCI World Index TRN

Sustainability-related information

Sustainability-related information

Under the EU Sustainable Finance Disclosure Regulation, products can be labelled as either Article 6, 8 or 9 fund.

Article 6 - The fund is not in scope of enhanced sustainability disclosures compared to Article 8 and 9.
Article 8 - The fund does not have a sustainable investment objective but promotes environmental or social characteristics and is subject to enhanced sustainability disclosures.
Article 9 - The fund has a sustainable investment objective and is subject to enhanced sustainability disclosures.

Regardless of Article 8 or 9, the companies in which investments are made must follow good governance practices, and sustainable investments must not do any significant harm.

Article 9

Morningstar

Morningstar

Copyright © Morningstar, Inc. All Rights Reserved. The information contained herein: (1) is proprietary to Morningstar and/or its content providers; (2) may not be copied or distributed; and (3) is not warranted to be accurate, complete or timely. Neither Morningstar nor its content providers are responsible for any damages or losses arising from any use of this information. Past performance is no guarantee of future results. Download The Morningstar Rating for Funds (chapter: The Morningstar Rating: Three-, Five-, and 10-Year) on the Morningstar website.

Rating (28/02)

  • Overview
  • Performance & costs
  • Portfolio
  • Sustainability
  • Commentary
  • Documents
Switch funds

Fund topics

Overview
Performance & costs
Portfolio
Sustainability
Commentary
Documents
Switch funds

MISSING: fund.detail.tabs.

Key points

  • Long-term growth potential — Participate in the megatrend of electrification of energy supply & benefit from the transition to new ways of producing, distributing and managing energy.
  • Focus on solution providers — Invest in the technology leaders and innovative winners of this global revolution

About this fund

RobecoSAM Smart Energy Equities is an actively managed fund that invests globally in companies providing technologies for clean energy production, distribution, power management infrastructure and energy efficiency. The selection of these stocks is based on fundamental analysis. The fund's objective is to achieve a better return than the index. The fund has sustainable investment as its objective, within the meaning of Article 9 of the Regulation (EU) 2019/2088 of 27 November 2019 on Sustainability-related disclosures in the financial sector. The fund's objective is also to achieve a better return than the index. The strategy integrates sustainability criteria as part of the stock selection process and through a theme-specific sustainability assessment. The portfolio is built on the basis of an eligible investment universe that includes companies whose business models contribute to the thematic investment objectives. The assessment regarding relevant SDGs uses an internally developed framework, more information on which can be obtained at www.robeco.com/si.

Key facts

Per 28-02-2023

Total size of fund

$ 3,928,171,487

Size of share class

$ 294,504,410

Inception date fund

29-10-2020

1-year performance

-0.64%

Dividend paying

No

The value of the investments may fluctuate. Past performance is no guarantee of future results.
Performances are net of fees and based on transaction prices.

Fund manager

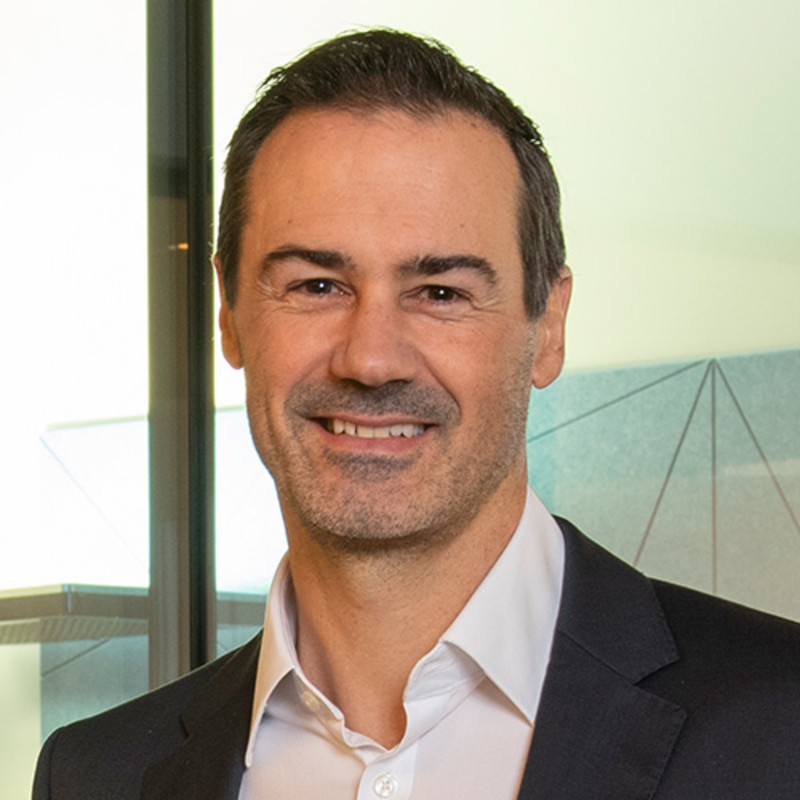
Roman Boner

Michael Studer PhD

Roman Boner is Portfolio Manager of the RobecoSAM Smart Energy Equities strategy. Before joining Robeco in 2021, Roman was a Senior Portfolio Manager at Woodman Asset Management. Prior to that, he spent six years at Swisscanto (later part of Zurich Kantonalbank) as a Senior Portfolio Manager responsible for a sustainable global equity fund and co-manager of the thematic Global Water und Climate Fund. Roman started his career in 1996 at UBS working in different divisions including Private Banking, Asset Management and Trading. In 2003, he became Portfolio Manager at UBS Global Asset Management and, from 2005 onwards, focused on sustainable thematic equities strategies including Energy Efficiency and Climate change accounts. Roman graduated from the University of Applied Sciences Zurich in Economic and Business Administration and is a CFA® charterholder. Michael Studer is Co-Portfolio Manager of RobecoSAM Smart Energy Equities strategy and also covering thematic research with a focus on Technology within the Thematic Investing Energy/Mobility/Materials team. Before joining Robeco in 2021, he spent three years at Acoro Asset Management, where he was an investment manager focused on the IT sector (semiconductors, software and internet). Prior to that, he worked as a Senior Equity Analyst covering IT at Julius Bär, Bank J. Safra Sarasin and as a sellside analyst at Bank am Bellevue with a total 10-year tenure. Michael started his career in 2007 as a consultant for Strategy & Operations in the Financial Services Industry at Deloitte. Michael holds a PhD in Accounting and Controlling and a Master in Information and Technology Management from the University of St Gallen (HSG), as well as a Master in International Management from the Community of European Management Schools (CEMS). He also studied at the Rensselaer Polytechnic Institute (RPI) in Troy, New York (USA).

Key points
About the fund
Key facts
Fund manager

Performance

Per period

Per annum

  • Per period
  • Per annum
Per 28-02-2023
Per period Fund Index

1 month

-1.17%

-2.40%

3 months 

3.24%

0.06%

YTD

10.79%

4.50%

1 year

-0.64%

-7.33%

2 years

-0.73%

1.30%

3 years

21.61%

9.90%

5 years

13.03%

6.88%

10 years

10.57%

8.77%

Since inception 10/2006

7.09%

6.28%

The value of the investments may fluctuate. Past performance is no guarantee of future results.
Annualized (for periods longer than one year).
Performances are net of fees and based on transaction prices.
Per annum Fund Index

2022

-21.54%

-18.14%

2021

17.95%

21.82%

2020

58.70%

15.90%

2019

40.28%

27.67%

2018

-16.69%

-8.71%

2020-2022

13.67%

4.94%

2018-2022

11.41%

6.14%

The value of the investments may fluctuate. Past performance is no guarantee of future results.
Annualized (for periods longer than one year).
Performances are net of fees and based on transaction prices.

Statistics

Statistics

Hit-ratio

  • Statistics
  • Hit-ratio
Per 28-02-2023
Statistics 3 years 5 Years

Tracking error ex-post (%)

The ex-post tracking error is defined as the volatility of the fund's achieved excess return over the index return. In fund management, most managers are subject to an ex-ante (pre-determined) tracking error, which defines the extent of the additional risk they may take when aspiring to outperform the fund's benchmark. The ex-post tracking error explains the distribution of past fund performances compared to those of its underlying benchmark. With a higher tracking error, the fund's returns deviate more from its index's returns, hence there is a greater chance that the fund may outperform. The wider the spread of returns relative to the benchmark, the more "actively" a fund has been managed. In contrast, a low tracking error indicates more "passive" management.

14.09

12.82

Information ratio

This ratio serves to evaluate the quality of the excess return a fund manager has achieved because it takes the active risk involved into account. The information ratio is defined as the excess return over the benchmark return divided by the fund's tracking error. The higher the information ratio, the better. For example, a fund with a tracking error of 4% and an excess return of 2% over benchmark has an information ratio of 0.5, which is quite good.

0.98

0.64

Sharpe ratio

This ratio measures the risk-adjusted performance and allows the performance quality of different investments to be compared. It is calculated by subtracting the risk-free rate from the fund's returns and dividing the result by the fund's standard deviation (risk). So the Sharpe ratio tells us whether a fund's returns are the result of smart investment decisions or stem from taking extra risk. The higher the ratio, the better, meaning that a greater return is achieved per unit of risk. This ratio is named after its inventor, Nobel Laureate, William Sharpe.

0.79

0.53

Alpha (%)

Alpha measures the difference between a portfolio's actual return and its expected performance, given the level of risk, compared to the benchmark. A positive alpha figure indicates that the fund has performed better than expected, given the level of risk. Beta is used to calculate the level of risk compared to the benchmark..

12.00

7.57

Beta

Beta is a measure of a portfolio's volatility, or systematic risk, in comparison to the benchmark. A beta of 1 indicates that the portfolio will move with the benchmark. A beta of less than 1 means that the portfolio will be less volatile than the benchmark. A beta of more than 1 indicates that the portfolio will be more volatile than the benchmark. For example, if a portfolio's beta is 1.2 it is theoretically 20% more volatile than the benchmark.

1.24

1.25

Standard deviation

Standard deviation is a measure of the dispersion of a set of data from its mean. The more spread out the data is, the higher the deviation. In finance, standard deviation is applied to the annual rate of return of an investment to measure the investment's volatility (risk).

28.62

25.62

Max. monthly gain (%)

The maximum (i.e. highest) absolute positive monthly performance in the underlying period.

22.22

22.22

Max. monthly loss (%)

The maximum (i.e. highest) absolute negative monthly performance in the underlying period.

-12.86

-12.86

Hit-ratio 3 years 5 Years

Months out performance

Number of months in which the fund outperformed the benchmark in the underlying period.

22

34

Hit ratio (%)

This percentage indicates the number of months in which the fund outperformed in a given period.

61.1

56.7

Months Bull market

Number of months of positive benchmark performance in the underlying period.

22

38

Months outperformance Bull

Number of months in which the fund outperformed positive benchmark performance in the underlying period.

14

24

Hit ratio Bull (%)

This percentage indicates the number of months the fund outperformed a positive benchmark in an underlying period.

63.6

63.2

Months Bear market

Number of months of negative benchmark performance in the underlying period.

14

22

Months outperformance Bear

Number of months in which the fund outperformed negative benchmark performance in the underlying period.

8

10

Hit ratio Bear (%)

This percentage indicates the number of months the fund outperformed a negative benchmark performance in an underlying period.

57.1

45.5

Above mentioned ratios are based on gross of fees returns.

Costs

Per 28-02-2023
Cost of this fund Percentage

Ongoing charges

Indication of annual charges that are deducted for this fund. This indication is based on the costs over the last calendar year and may vary from year to year. Transaction costs incurred by the fund, any performance fees and other one-off costs are not included in the ongoing charges.

1.71%

Included management fee

A fee paid by the fund to the asset management company for the professional management of the fund.

1.50%

Included service fee

This fee is intended to cover official fees, such as the cost of annual reports, annual shareholders' meetings and price publications.

0.16%

Transaction costs

The transaction costs shown are the average annual transaction costs over the last three years calculated in accordance with European regulations.

0.09%

Fiscal product treatment

The fund is established in Luxembourg and is subject to the Luxembourg tax laws and regulations. The fund is not liable to pay any corporation, income, dividend or capital gains tax in Luxembourg. The fund is subject to an annual subscription tax ('tax d'abonnement') in Luxembourg, which amounts to 0.05% of the net asset value of the fund. This tax is included in the net asset value of the fund. The fund can in principle use the Luxembourg treaty network to partially recover any withholding tax on its income.

Fiscal treatment of investor

The fiscal consequences of investing in this fund depend on the investor's personal situation. For private investors in the Netherlands real interest and dividend income or capital gains received on their investments are not relevant for tax purposes. Each year investors pay income tax on the value of their net assets as at 1 January if and inasmuch as such net assets exceed the investor’s tax-free allowance. Any amount invested in the fund forms part of the investor's net assets. Private investors who are resident outside the Netherlands will not be taxed in the Netherlands on their investments in the fund. However, such investors may be taxed in their country of residence on any income from an investment in this fund based on the applicable national fiscal laws. Other fiscal rules apply to legal entities or professional investors. We advise investors to consult their financial or tax adviser about the tax consequences of an investment in this fund in their specific circumstances before deciding to invest in the fund.

Performance
Price development
Statistics
Cost of this fund
Fiscal: product
Fiscal: investor

Fund allocation

Asset

Currency

Sector

Top 10

  • Asset
  • Currency
  • Sector
  • Top 10
Per 28-02-2023

Policies

  • The fund can engage in currency hedging transactions. Typically currency hedging is not applied.

  • In principle the fund does not intend to distribute dividend and so both the income earned by the fund and its overall performance are reflected in its share price.

  • RobecoSAM Smart Energy Equities is an actively managed fund that invests globally in companies providing technologies for clean energy production, distribution, power management infrastructure and energy efficiency. The selection of these stocks is based on fundamental analysis. The fund has sustainable investment as its objective within the meaning of Article 9 of the European Sustainable Finance Disclosure Regulation. The fund furthers the decarbonization of the global energy sector through investments in clean energy sources, energy efficient products and infrastructure and by the electrification of the industrial, transportation and heating sectors. This is done by investing in companies that advance the following UN Sustainable Development Goals (UN SDGs): Affordable and Clean Energy goal, Decent work and economic growth, Industry, innovation and infrastructure, Sustainable cities and communities, and Climate action. The fund integrates ESG (Environmental, Social and Governance) factors in the investment process and applies Robeco’s Good Governance policy. The fund applies sustainability indicators, including but not limited to normative, activity-based and region-based exclusions, and proxy voting. The fund also aims to achieve a better return than the index. The strategy integrates sustainability criteria as part of the stock selection process and through a theme-specific sustainability assessment. The portfolio is built on the basis of an eligible investment universe that includes companies whose business models contribute to the thematic investment objectives. The assessment regarding relevant SDGs uses an internally developed framework, more information on which can be obtained at www.robeco.com/si. Benchmark: MSCI World Index TRN. The majority of stocks selected will be components of the benchmark, but stocks outside the benchmark may be selected too. While the investment policy is not constrained by a benchmark, the fund may use one for comparison purposes. The fund can deviate substantially from the issuer, country and sector weightings of the benchmark. There are no restrictions on the deviation from the benchmark. The benchmark is a broad market-weighted index that is not consistent with the sustainable objective of the fund.

  • Risk management is fully integrated into the investment process to ensure that positions always meet predefined guidelines.

Fund allocation
Policies

Sustainability-related disclosures

Full sustainability-related disclosures
Download full report
Summary sustainability-related disclosures
Download summary

Labels

Febelfin

Febelfin

The fact that the sub-fund has obtained this label does not mean that it meets your personal sustainability goals or that the label is in line with requirements arising from any future national or European rules. The label obtained is valid for one year and subject to annual reappraisal. More information on this label.

Sustainability profile

Per 28-02-2023
Exclusions +
ESG Integration
Voting
Target Universe

SDG Impact Alignment

Per 28-02-2023

This distribution across SDG scores shows the portfolio weight allocated to companies with a positive, negative and neutral impact alignment with the Sustainable Development Goals (SDG) based on Robeco’s SDG Framework. The frameworks, which utilizes a three-step approach to assess a company’s impact alignment with the relevant SDGs, provides a methodology for assigning companies with an SDG score. The score ranges from positive to negative impact alignment with levels from high, medium or low impact alignment. This results in a 7-step scale from -3 to +3. If the data set does not cover the full portfolio, the figures shown above each impact level sum to the coverage level to reflect the data coverage of the portfolio, with minimal deviations that reflect rounding. Weights < 0.5% will show as 0. If an index has been selected, the same figures are also provided for the index. Holdings mapped as corporates and/or sovereign are included in the figures. For more information, please visit https://www.robeco.com/docm/docu-brochure-robecosam-sdg-framework.pdf

CGF ENER_20230228-CGF ENER_20230228-sdgAggregateImpactDistribution.png esgAllImage

Sustainability

Per 28-02-2023

The fund's sustainable investment objective is to further the transformation and decarbonization of the global energy sector. The transformation and decabonization of the energy sector and sustainability considerations are incorporated in the investment process by the means of a target universe definition, exclusions, ESG integration, a carbon footprint target and voting. The fund only invests in companies that have a significant thematic fit as per Robeco's thematic universe methodology. Through screening on both Robeco's internally developed SDG Framework and Robeco’s exclusion policy, the fund does not invest in issuers that have a negative impact on the SDGs, are in breach of international norms or where products have been deemed controversial. Financially material ESG factors are integrated in the bottom-up fundamental investment analysis to assess existing and potential ESG risks and opportunities. The fund's weighted carbon footprint will be equal to or better than that of its Climate Transition Benchmark. In addition, where a stock issuer is flagged for breaching international standards in the ongoing monitoring, the issuer will become subject to exclusion. Lastly, the fund makes use of shareholder rights and applies proxy voting in accordance with Robeco's proxy voting policy.

Information
Profile
SDG Impact Alignment
Sustainability

Market development

Per 28-02-2023

After the very strong performance of equities in January, markets were weaker across the board in February, especially in Asia and the US. However, European stocks outperformed the US market again driven by better-than-expected economic data. Hopes of rate cuts, with inflation numbers in the US peaking in January, were short-lived as strong employment data and sticky inflation are probably forcing the Fed to keep rates 'higher for longer'. Energy prices, particularly in Europe, continued their downward trajectory. The Q4 earnings season was solid, particularly in Europe as the initial full-year outlooks were better than feared.

Performance explanation

Per 28-02-2023

Based on transaction prices, the fund's return was -1.17%. Energy Management was again the strongest cluster by far in February thanks to strong stock selection. Semiconductor companies Renesas and Analog Devices were the highlights as both companies posted good Q4 results and outlooks. The Energy Distribution cluster delivered a strong relative performance due to Quanta Services and Schneider Electric trading heavily up on strong results. The Electric Networks sub-cluster lagged again as its defensive characteristics were out of favor. The Energy Efficiency cluster was a mixed bag. Big Data performed strongly thanks again to Lattice Semiconductors. In Buildings, industrial company Legrand and building materials maker Carlisle performed well, whereas Rockwool suffered from a weak outlook. Transport reversed from the stellar previous month, partially driven by underperformance of EV maker BYD and green hydrogen producer Plug Power. Renewable Energy had another slightly weaker month as the market is consolidating after last year's strong outperformance.

Expectation of fund manager

Roman Boner

Michael Studer PhD

Inflation in North America and Europe likely has peaked, but fears remain that inflation will stay higher for longer and the Fed tightening cycle might continue for a little while. Long-term interest rates started to reflect this new outlook and reversed some of the early year decline and are already above the levels seen at the beginning of the year. Overall stickier inflation might limit upside for equity valuations but should give support on corporate earnings. With China quickly easing from its zero-Covid policy, we expect improving global supply chains going in 2023 and easing input cost inflation, which bodes well for a margin recovery of some of our core holdings, particularly in the Renewable Energy and Energy Efficiency clusters. Therefore, we are confident on the earnings outlook for our portfolio going into 2023, even with a more challenging macro backdrop, as high energy prices and the urgent need for energy independence act as catalysts for more investments in smart energy technologies. The fund management team remains constructive on the mid to long-term prospects for our holdings.

Market development
Performance explanation
Expectation of fund manager

Fund documents

  • Factsheet
  • Product sheet
  • Portfolio Manager's Update
  • Prospectus
  • Articles of association
  • Key Information Document (PRIIP)
  • Full sustainability-related disclosures
  • Summary sustainability-related disclosures

(Semi) annual reports

  • Annual report 2021
  • Annual report 2020
  • Annual report 2019
  • Semi-annual report 2022
  • Semi-annual report 2021
  • Semi-annual report 2020

Announcements

  • Publication Semi-annual reports 2022 (31-08-2022)
  • RobecoSAM Smart Energy: Announcement (18-10-2021)
  • Semi-annual 2021 available (31-08-2021)
  • RobecoSAM Smart Energy: Annoucement (21-04-2021)
Fund documents
Reports
Announcements

Related insights

Read

08-03-2023 · Insight

Embracing equality – Quotas are nice but C-suites are better

Learn more

Read

23-02-2023 · Webinar

Thematic strategies investing in the sustainable world of the future

Learn more

Read

14-02-2023 · Insight

Heat pumps – creating more than just a lot of hot air

Learn more

Read

14-12-2022 · Video

The future of energy is clean, electric and efficient

Learn more

Read

07-10-2022 · Insight

The energy shock will accelerate investment in smart energy solutions

Learn more

Read

22-07-2022 · Insight

Harmful algal blooms are threatening surface waters

Learn more

Read

16-06-2022 · Insight

Circular solutions – a triple threat for supply chain challenges

Learn more

Read

14-04-2022 · Insight

Electric vehicle adoption accelerating as costs fall

Learn more

Read

06-04-2022 · Insight

Healthy Living - a defensive alternative to blistering markets

Learn more

Read

08-03-2022 · Insight

How investors can break gender bias

Learn more

Read

14-02-2022 · Insight

Smart Energy’s mid-term outlook has never been brighter

Learn more

Read

23-12-2021 · Insight

A perfect storm in energy markets

Learn more

22-12-2021 · Product video

Towards an electrifying future | Robeco Smart Mobility Strategy

Learn more

Read

30-11-2021 · Product webinar

Energy and supply chain shortages emphasize need for Smart solutions

Learn more

Read

Read

18-11-2021 · Insight

Power play – why lithium remains the unchallenged champion of battery metals

Learn more

Read

18-10-2021 · Stunning statistics

Chipping away at water supplies

Learn more

15-10-2021 · Insight

Six steps to climate-proof your investments

Learn more

Read

Read

06-10-2021 · Research

Historic fund launches a new water study

Learn more

01-10-2021 · Insight

At the forefront of climate investing solutions

Learn more

Read

Read

01-09-2021 · Product video

Who’s behind the Sustainable Water strategy?

Learn more

Read

01-09-2021 · Product webinar

Celebrating two decades of Sustainable Water Equities

Learn more

Read

04-08-2021 · Insight

When less is more - making manufacturing clean, green, and lean

Learn more

Read

01-07-2021 · Video

Tackle resource scarcity through innovative materials companies | RobecoSAM Smart Materials

Learn more

15-06-2021 · Product video

Water scarcity: investors are part of the solution

Learn more

Read

Read

10-06-2021 · Insight

Show, don't tell – investing in sustainable themes with demonstrated impact

Learn more

Read

03-06-2021 · Insight

Eliminating PFAS brings fresh opportunities for water investments

Learn more

Read

21-04-2021 · Stunning statistics

Trashed cash – USD 6 billion in assets dumped each year

Learn more

Read

07-04-2021 · Product video

Sustainable Water – Tap into a liquid asset

Learn more

Read

06-04-2021 · SI Opener

SI Opener: Investing in health and disease prevention is the best cure

Learn more

Read

22-03-2021 · Insight

Hydrogen power — between hype and hope

Learn more

Read

08-03-2021 · Insight

Creating equity for all goes beyond a firm’s walls

Learn more

Read

05-03-2021 · Insight

The healthy living trend is to stay in the long run

Learn more

Read

03-03-2021 · Product video

The mobility of the future is electric

Learn more

Read

03-03-2021 · Insight

The future of energy will be renewable, electric and efficient

Learn more

Read

26-01-2021 · Interview

Clean Energy Outlook 2021 – Global decarbonization efforts to drive further growth

Learn more

Read

27-10-2020 · Interview

Green hydrogen: powering the low-carbon future

Learn more

Read

16-10-2020 · Insight

Investing in the circular economy

Learn more

Read

20-02-2020 · Stunning statistics

Short-haul flights are the worst offenders for CO₂

Learn more

Read

13-02-2020 · Insight

Creating value in loops

Learn more

08-03-2019 · Insight

Working towards greater gender equality

Learn more

Read

Read

21-02-2018 · Insight

Fact or fiction: SI is only about negative screening

Learn more

Read

11-12-2017 · Insight

Smart investing in smart materials

Learn more

Read

03-07-2017 · Insight

Ten things you should know about minimum volatility investing

Learn more

Let's keep the conversation going

Keep track of fast-moving events in sustainable and quantitative investing, trends and credits with our newsletters.

Stay updated
Robeco

Robeco aims to enable its clients to achieve their financial and sustainability goals by providing superior investment returns and solutions.

Key topics
Insights
Funds
Strategies
Opportunities
Sustainable investing
About us
Quick links
Contact
Media
Careers
Glossary
Insurers
Advisor education
Expertise
Sustainable investing
Quantitative investing
Thematic investing
Emerging markets
Credit investing

Disclaimer Privacy and Cookie Statement Policies Security

The information contained in the Website is solely intended for professional investors within the meaning of the Dutch Act on the Financial Supervision (Wet op het financiële toezicht) or persons which are authorized to receive such information under any other applicable laws. More information about Robeco Institutional Asset Management B.V.

A consumer? Go to the Robeco consumer websites.