Head of Exchange Traded Funds


• Insight
Unlocking EM potential: Our new active ETF
The stars are aligning. Emerging markets are showing renewed momentum, Robeco brings decades of quant expertise in these dynamic economies, and investors are increasingly looking for cost-efficient, transparent ways to capture alpha.
Authors


Chief Researcher
Summary
With our new 3D Emerging Markets ETF, we bring these elements together – combining EM growth potential, the power of our Enhanced Indexing strategy, and Robeco’s 15-year EM track record in a liquid, dynamic, and rules-based package.
Here are eight reasons why this ETF is worth considering:
Robeco has been at the forefront of quantitative investing for over two decades, with an approach rooted in academic research and refined through years of real-world application.
What sets Robeco apart is how we’ve gone beyond the textbook – developing proprietary models, tailoring signals for different market environments, and blending quant expertise with real-world insight. Our 3D ETFs build on that legacy. It’s not just a new product – it’s a logical step in a 20-year journey of innovation, performance, and disciplined investing.
With this launch, we’re making our EM quant strategy available in a format that’s efficient, transparent, and easy to access Nick King

Nick King
Head of Exchange Traded Funds
2. An enviable EM track record
We have managed EM quant portfolios for 15 years, showing consistent outperformance. Our strategy has evolved through enhanced factor definitions, the use of short-term signals, and advanced tools like machine learning and natural language processing. For example, our Sustainable Active Equities outperformed eight out of ten years since inception, with an annualized outperformance of 2.6% over this period.
Table 1 | Performance of Robeco Emerging Markets Sustainable Active Quant strategy over time
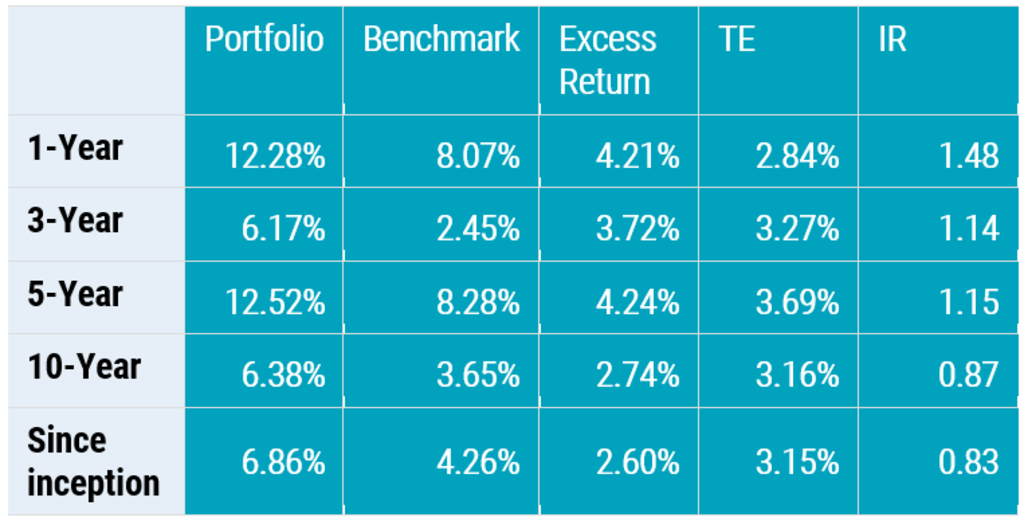
TE: Realized tracking error IR = Information ratio
Past performance is no guarantee of future results. The value of your investments may fluctuate. Source: Robeco. Illustrative strategy. Figures are based on the live portfolios in the strategy in EUR and are gross of fees. Inception date: February 2015. Performance measured against MSCI EM Index. The currency in which the past performance is displayed may differ from the currency of your country of residence. Due to exchange rate fluctuations the performance shown may increase or decrease if converted into your local currency. In reality, costs (such as management fees and other costs) are charged. These have a negative effect on the returns shown. Data as of April 2025.
Figure 1 | Performance of Robeco Emerging Markets Sustainable Active Quant strategy per calendar year versus the index
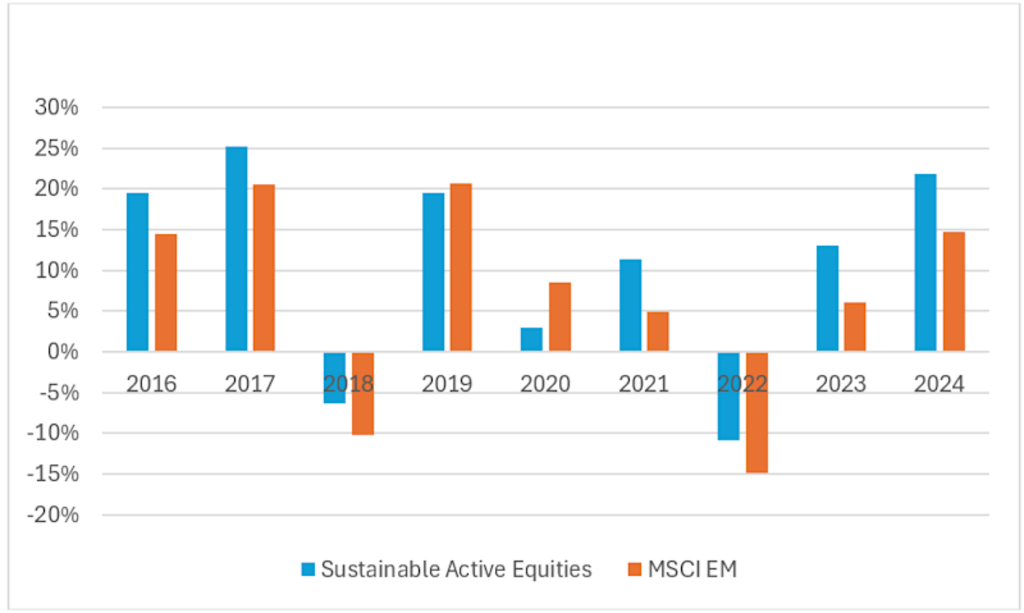
Past performance is no guarantee of future results. The value of your investments may fluctuate.
Source: Robeco. Illustrative strategy. Figures are based on the live portfolios in the strategy in EUR and are gross of fees. Inception date: February 2015. Performance measured against MSCI EM Index. The currency in which the past performance is displayed may differ from the currency of your country of residence. Due to exchange rate fluctuations the performance measured may increase or decrease if converted into your local currency. In reality, costs (such as management fees and other costs) are charged. These have a negative effect on the returns shown. Data as of April 2025.
Our new ETF builds on the principles of our EM Enhanced Indexing strategy, which aims to deliver steady outperformance with a modest tracking error.1 Since inception, this approach has shown a strong realized information ratio of over 1.2 since inception compared to broad EM equity peers.2 Our edge lies in how we achieve this:
Roughly 80% of our EM outperformance cannot be explained by generic factors alone3 –it’s driven by proprietary signals and nuanced refinements.
We focus the risk budget where it matters: on alpha**, by maximizing our exposure to our enhanced factors with tight controls to avoid unrewarded deviations from the benchmark.
Our quant team collaborates with Robeco’s fundamental EM specialists to refine inputs, understand anomalies, and remain attuned to local realities – a rare advantage among quant managers.
*A metric that captures outperformance relative to risk taken.
**Alpha describes a strategy’s ability to beat the market; often referred to as excess return in relation to a benchmark, when adjusted for risk.

Robeco 3D Equity ETFs
3. Vast untapped potential in EM
Emerging markets offer growth potential at attractive valuations. Starting from a lower economic base, many EM economies have room to catch up – and they continue to trade at attractive discounts relative to developed markets.
Factor premiums tend to be strong and persistent in EM. While implementation costs are higher, the raw factor premiums we observe – especially using Robeco’s proprietary definitions – are often as pronounced as in developed markets, and sometimes even more so. This makes EM a fertile ground for quant investors; provided the approach is disciplined and cost-aware.
4. Diversification across – and within – regions
Adding EM to a portfolio can enhance diversification. DM markets like the US, Europe, and Japan tend to move in tandem. EM markets, however, are less aligned with one another: India might surge while China slows; Brazil may rise while South Africa lags.
This divergence offers unique opportunities – both between regions and within EM itself. After all, EM is a collection of diverse economies like Taiwan, Mexico, Saudi Arabia, and Poland, each with its own drivers, political structures, and investor behaviors. Having a diverse exposure is therefore essential.
Quant strategies thrive on such dispersion – it cushions volatility and creates opportunities for relative performance.
We’re much less likely to suffer from a value downturn across all these markets at the same time David Blitz


David Blitz
Chief Researcher
5. EM is a natural fit for quant – especially our brand of it
EM markets can be less efficient, and more retail-driven, leading to pricing anomalies that quant models can systematically exploit. Robeco’s proprietary factor model is specifically well-equipped for EM, with:
Adjustments for patchy data and dual listings
Residualized analyst revisions
Distress risk overlays to avoid value traps
Machine learning and NLP tools tailored to EM market dynamics.
6. Measured innovation
Robeco doesn’t adopt new tools for novelty’s sake. We integrated AI and NLP in a disciplined manner to enhance our investment process – particularly in markets like China, where local news and sentiment significantly influence prices.
Today, our EM strategy includes short-term signals discovered and enhanced using machine learning as well as NLP models analyzing local language sources and earnings calls, for example. We innovate with care, testing deeply, deploying deliberately, and iterating based on real-world performance.
7. Risk-aware portfolio construction
EM investing comes with volatility and surprises, which we manage through a disciplined, data-driven process:
Country and sector weights are tightly controlled
Dynamic, well-spent tracking error budget (around 1-1.5%) aims to ensure risk stays in line
Turnover (~50%) strikes a balance between agility and cost
Risk budgeting incorporates liquidity, volatility, correlation, and implementation costs
We focus on many small, deliberate tilts, rather than large macro bets – a strategy that has delivered consistently. 4
8. Smart access via the ETF format
“Liquidity is a key consideration in EM investing, as execution costs are typically higher,” says King. “This ETF will focus on the most liquid stocks to ensure smooth execution, while capturing the unique alpha of this capability.”
In an active ETF wrapper, Robeco’s EM strategy becomes even more compelling:
Transparent, cost-efficient, and tradable
Daily liquidity with competitive bid-ask spreads
A universe of highly liquid EM stocks thanks to an additional liquidity screen
The right approach for EM
Robeco’s 3D EM ETF strategy is particularly well suited to the complexity of emerging markets, thanks to its rules-based and risk-controlled nature which allows small but fruitful deviations from the benchmark. In EM, this approach is more effective than traditional passive strategies, thanks to the systematic way it draws on established alpha factors.
Moreover, investors increasingly weigh up a third dimension – sustainability – in their investment decisions. Rather than exclude stocks, our 3D approach is aimed at creating a portfolio that dynamically searches for the best possible trade-offs between risk, return and sustainability, based on pre-set targets and real-time market conditions. “We believe sustainability can be a key driver of long-term value and resilience,” says King. This is especially important in EM, where governance and transparency can vary widely.
This approach not only considers environmental and social risks as part of long-term portfolio construction to enhance long-term resilience, but also provides exposure to opportunities in sectors and companies that are aligned with broader sustainability trends. Rather than adhering to static sustainability constraints, the model adapts as markets and sustainability data evolve — enabling a flexible, forward-looking allocation.
Smart access to the next growth wave
Robeco’s 3D EM ETF combines alpha generation, disciplined risk control, and sustainability in a rules-based strategy tailored for emerging markets. It provides efficient exposure to a broad and diverse opportunity set – and a resilient way forward for investors seeking long-term growth.
Footnotes
1 Past performance is no guarantee for future results. The value of your investments may fluctuate.
2 Past performance is no guarantee for future results. The value of your investments may fluctuate. Our Emerging Markets (EM) strategy ranks first in its peer group with an IR of 1.26. This high IR indicates an efficient use of the risk budget (tracking error around 1%) in generating alpha for clients. Source: Robeco, Kenneth French data library. Blitz, D., 2024, “The unique alpha of Robeco Quant Equity strategies”, Robeco article. This is based on the annualized information ratio of the Robeco Emerging Enhanced Indexing Equities (since inception in July 2007), gross of fees in EUR. The value of your investments may fluctuate. Results obtained in the past are no guarantee for the future.
3 Blitz, D., 2024, “The unique alpha of Robeco Quant Equity strategies”, Robeco article.
4 Past performance is no guarantee of future results. The value of your investments may fluctuate. Source: Robeco. Illustrative strategy. Figures are based on the live portfolios in the strategies in EUR and are gross of fees. Inception dates: Emerging Markets Active Equity strategy: March 2007. Emerging Markets Enhanced Indexing strategy: July 2007. Performance measured against MSCI EM Index. The currency in which the past performance is displayed may differ from the currency of your country of residence. Due to exchange rate fluctuations the performance shown may increase or decrease if converted into your local currency. In reality, costs (such as management fees and other costs) are charged. These have a negative effect on the returns shown. Data as of March 2025.