Head of Conservative Equities and Chief Quant Strategist


• Insight
Quant chart: Successfully reducing drawdowns
In investing, minimizing losses is crucial for long-term capital growth. This timeless truth is especially relevant today, with major stock market indices experiencing significant drawdowns. To illustrate this point, a 20% loss requires “only” a 25% gain to recover, while a 50% loss demands a staggering 100% rebound.
Authors


Portfolio Manager



Researcher
The Robeco Conservative Equities strategy is designed to win by losing less during market downturns. Over its nearly 20-year live track record, the global equity market has endured ten distinct episodes of drawdowns exceeding 10%, as illustrated in Figure 1.
Figure 1 | Real-life drawdown reduction during ten distinct market drawdowns
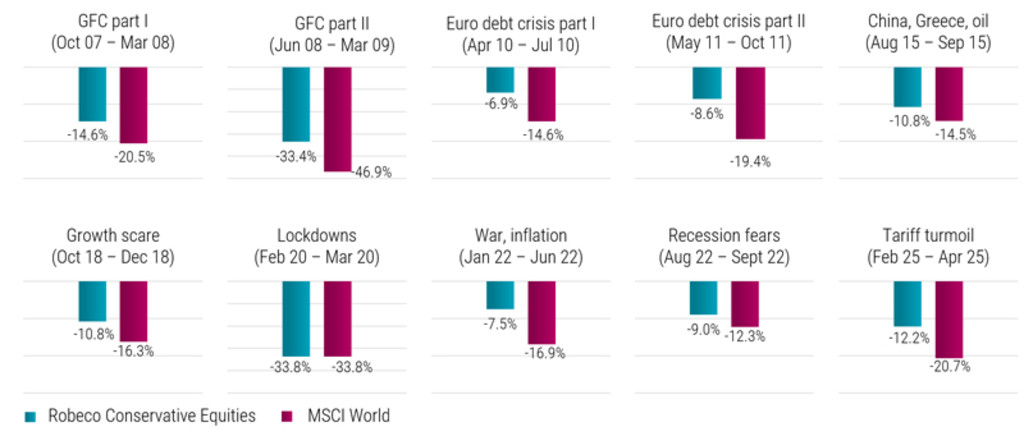
Past performance is no guarantee of future results. The value of your investment may fluctuate. Source: Robeco. The figure shows the maximum drawdowns of the Robeco Conservative Equities strategy versus the MSCI World Index during ten distinct market drawdown episodes since the start of the strategy in October 2006, as selected by Robeco. The length of the period is based on when MSCI World reached the pre-sell-off level (not yet reached again for the “tariff turmoil” scenario, for which the drawdowns are measured up to April 29, 2025). Drawdowns are measured based on daily data in EUR of the net asset value of the representative account Robeco QI Institutional Global Developed Conservative Equities strategy, gross-of-fees. In reality, costs such as management fees and other costs are charged. These have a negative effect on the returns shown.
Since then, the strategy has successfully navigated multiple periods of volatility, including the European debt crisis (2010/2011), the oil price shock (2015), and the growth scare of 2018, which, notably, was also linked to early tariff tensions under the Trump administration. These drawdown periods were followed by the first Covid-19 lockdown (2020), stagflation concerns (2022), and the ongoing tariff turmoil (2025). While the current episode is still evolving, recent uncertainty surrounding central bank independence has further unsettled investors.
Across all these ten market corrections — with the exception of the first pandemic lockdown — the Robeco Conservative Equities strategy delivered the expected downside protection. More specifically, while the MSCI World Index experienced an average drawdown of 21.6%, the Robeco strategy averaged just a 14.8% drawdown, reducing relative risk by more than 30%. The ability to limit loss highlights the strategy’s effectiveness in preserving capital and supporting long-term compounding.
Although the strategy may lag during strong bull markets, its consistent downside protection has contributed to better long-term results. From its inception in October 2006 through March 2025 (excluding April data), the strategy has delivered an annualized return of 8.3%, compared to 7.8% for the MSCI World Index, both in EUR. Importantly, it has done so with significantly lower volatility — offering equity investors a smoother, more reassuring ride.
Important information
THIS WEBSITE IS SOLELY INTENDED FOR PROFESSIONAL INVESTORS, WHICH HAS THE MEANING ASCRIBED TO IT IN THE SECURITIES AND FUTURES ORDINANCE (CAP. 571 OF THE LAWS OF HONG KONG) AND ITS SUBSIDIARY LEGISLATION. Investment involves risks. Past performance is not indicative of future performance. The information contained in this website is provided for reference only and does not constitute investment advice or an offer or solicitation to buy or sell in any securities or to adopt any investment strategy. Investors should not base their investment decisions solely on the information provided on this website and are advised to seek independent advice (including advice on tax implications) before making any investment decisions. Investors should ensure they fully understand the risks associated with the investment products and should also consider their own investment objectives and risk tolerance level. The investment decision is yours. You should not invest unless the intermediary who sells you the investment products has advised you that it is suitable for you and has explained how it is consistent with your investment objectives. Please refer to the relevant offering documents or other legal documents for further details including the risk factors. This website is published by Robeco Hong Kong Limited which is regulated by the Hong Kong Securities and Futures Commission (“SFC”) (CE No. APU851). This website has not been reviewed by the SFC. No assurance can be given that the investment objective of any investment products will be achieved. No representation or promise as to the performance of any investment products or the return on an investment is made. The value of investments may fluctuate. Past performance, projections, or forecasts included in this website should not be regarded as guarantees or indications of future performance, and no express or implied warranty is provided. The contents of this website are based on sources believed to be reliable, but due to the nature of information delivery technology and the necessity of using multiple data sources, including third party content, their accuracy is not guaranteed. The opinions expressed are as of the date shown above and may change as market conditions evolve, and are subject to change without notice. These opinions may differ from those of other Robeco investment professionals. Robeco accepts no liability for any direct, indirect, or consequential loss arising from the use of this material or any comments, opinions, or estimates contained herein. Robeco has no duty to update this website or any website content. Materials on this website may not be reproduced, distributed, or published without prior written permission from Robeco. Unless otherwise specified, Source: Robeco.