Head of Solutions Research



• Insight
Integrating the SDGs into government bond portfolios
Extending the Robeco SDG Framework to cover government bonds can provide a useful way of bridging the funding gap for achieving the Sustainable Development Goals, says quant researcher Laurens Swinkels.
Authors


Strategist
Summary
- New framework can select government bonds aligned with the SDGs
- Three-step process attributes scores to countries based on SDG potential
- Weighting system used to create SDG Core and Focus hypothetical portfolios
The government financing gap in achieving the UN’s Sustainable Development Goals (SDGs) by 2030 amounts to an annual shortfall of USD 2.6 trillion, or 2.7% of global output. Sovereign debt can be a channel for funding sustainable development, yet research on its role in this area is sparse.
To bridge this gap, Robeco developed a framework evaluating countries on their SDG policies, their finance needs for sustainable development, and their sustainability commitments. Those satisfying these criteria are prioritized inclusion in two hypothetical SDG-aligned government bond portfolios.
The new framework conducts a three-step evaluation that gives SDG scores to 170 countries, ranging from -3 (highly negative) through 0 (neutral) up to +3 (highly positive). In step one, we measure a country's SDG-related policies using 71 indicators linked to SDG targets. For instance, for SDG 3 (Good health and well-being) we can use indicators such as maternal mortality rates and health expenditure to GDP ratio. For SDG 8 (Decent jobs and economic growth), we can assess children's workplace rights.
Step two assesses whether countries need additional capital to attain the SDGs. We consider income classification and corruption levels; lower-income countries with moderate or low corruption receive a +1 score, indicating the need for more capital. In step three, we screen for behaviors contradicting the SDGs. Factors like poor governance, autocracy, sanctions, violations of political rights, and high political instability negatively impact the score, ranging from -1 to -3.
Of the 170 countries analyzed, 34% receive a positive score, 22% a neutral score, and 44% a negative score. Among the positive scores, 14 countries got the highest +3 score, 24 received a +2 and 19 were awarded a +1. The broad distribution is shown in the graphic below.
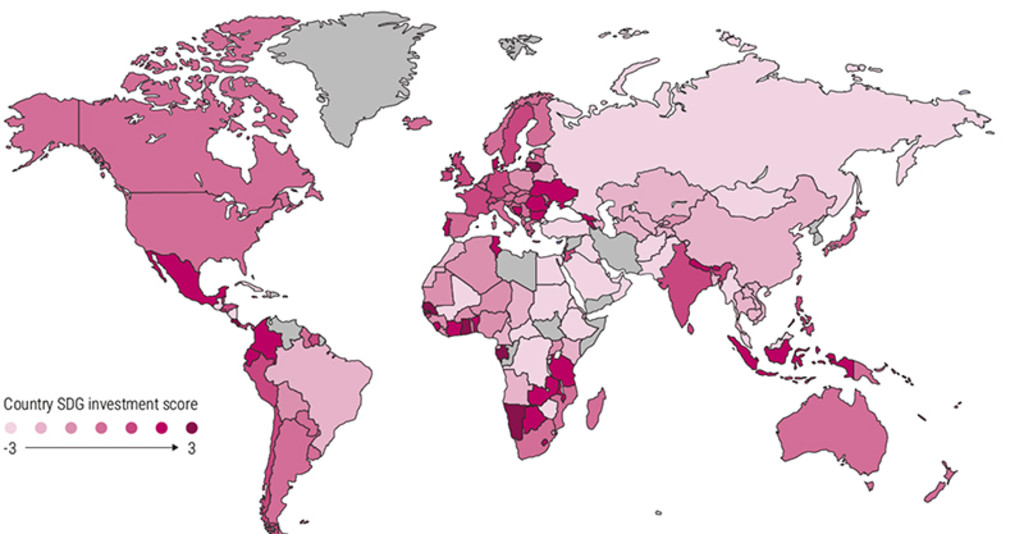
Source: Robeco. This chart shows how Robeco’s country SDG scores are distributed globally. Countries shown in darker colors have more positive scores than countries in lighter shades. Countries that lack a score, due to data unavailability, are shown in grey. Date: 2022.
It's crucial to distinguish between Robeco's country SDG scores and ESG scores. Ironically, countries that have made considerable progress in meeting the goals, and have higher wealth and better ESG ratings, often receive neutral SDG scores on this framework. This mirrors the SDG scoring methodology, which aims to recognize countries with strong policies and financial needs, rather than strictly evaluating their current SDG achievement level.
We then used all this information to create two hypothetical strategies: an ‘SDG Core’ portfolio with relatively low default risk and high liquidity, and an ‘SDG Focus’ portfolio with a greater default risk but higher expected returns.
Another three-step process is used to create these portfolios. First it is necessary to draw up a list of the government bonds available for each one. Then we use a weighting system to see which are eligible based on their SDG scores. Finally, we determine the weights for bonds in the portfolio. The results for both were surprising.
SDG Core portfolio
Here, the main measure for ‘safe and liquid’ is whether the sovereign is considered a ‘safe haven’ such as Germany, Japan, the UK or US. We then add countries with an AAA or AA credit rating and a bond market value of at least USD 50 billion, leading to a set of 21 countries.
For the SDG scores, those with a negative or neutral score were discarded, which excludes 13 out of the 21 countries – including the giant bond markets of US and Japan. This step has therefore major consequences for the portfolio, since if we had only excluded the three negative scores, the US and Japan would have gone back in.
When determining the portfolio weights, we want to invest relatively more in bonds with a higher SDG score while also recognizing that larger bond markets have more investment capacity and liquidity. To achieve this, we use a multiplier of 1.00 times for an SDG score of +3; 0.50 times for an SDG score of +2; and 0.25 times for an SDG score of +1. To ensure diversification, the maximum allocation to any one sovereign is 25%.
The resulting SDG Core portfolio is shown in the chart below. The UK, France, and Germany each account for the maximum of 25% allocation. Denmark, the only country with an SDG score of +2, has a 7.7% allocation. Therefore this portfolio is heavily tilted towards European government bonds.
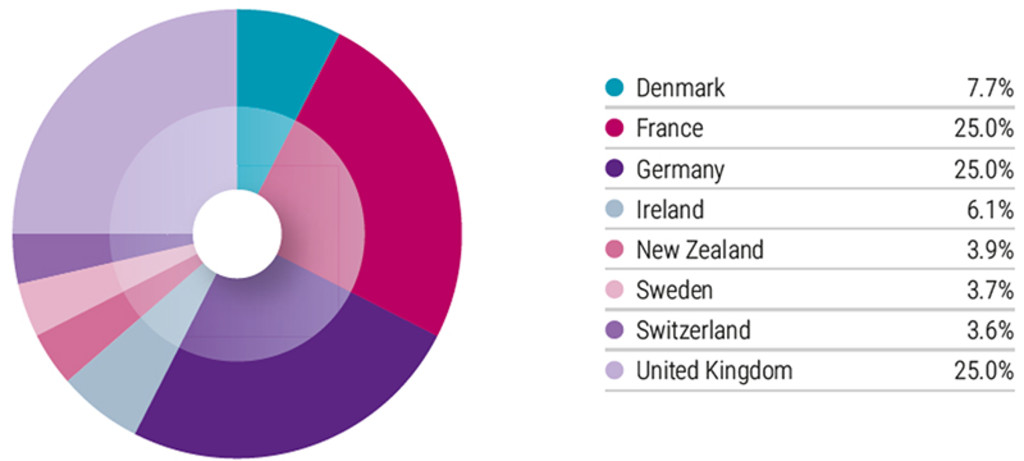
Source: Robeco. Country SDG scores as of 2022
SDG Focus portfolio
For the SDG Focus portfolio, the emphasis is much more on the SDGs themselves, with safety, liquidity, and credit ratings requirements as secondary concerns. This results in a riskier portfolio that includes all sovereigns except for those that already qualify for SDG Core.
Here, the size of the country’s bond market needs to be at least USD 1 billion. Investors who care more about liquidity may use an alternative threshold where the bond market’s size rises to USD 10 billion. The minimum credit rating should be B3 or better (i.e. not starting with C), avoiding countries in the process of defaulting. This leaves 71 countries eligible for inclusion.
To create a portfolio with maximal positive exposure to the SDGs, we include only the +2 or +3 scores. This further reduces the sample from 71 to 22 eligible countries; even though 67 countries have a +2 or +3 rating, only 22 of them have functional bond markets. Unfortunately, only one-third of the countries that warrant investment from an SDG perspective are accessible for investors.
For the weighting, we multiply a country’s total bond market capitalization with a factor of 1.00 for an SDG score of +3, and 0.50 for an SDG score of +2. The minimum weight is 2% and maximum weight is 10%. The resulting SDG Focus portfolio is shown in the chart below. It now includes far more emerging markets, including nations from Africa, South America and Asia, but also includes more developed nations like Portugal.
SDG focus portfolio composition
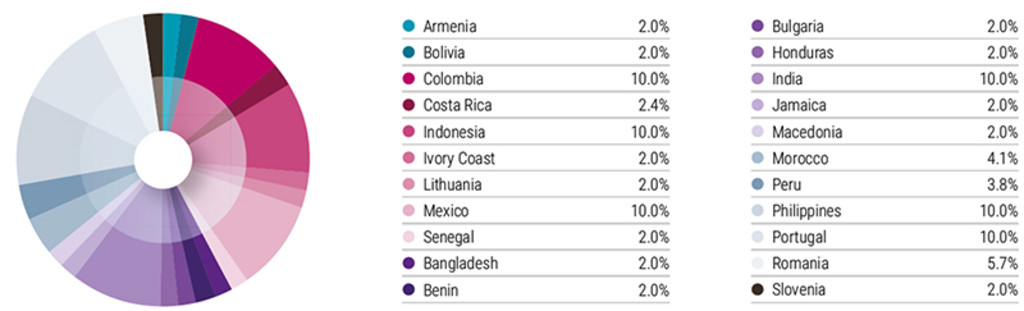
Source: Robeco. Country SDG scores as of 2022
Get the latest insights
Subscribe to our newsletter for investment updates and expert analysis.
In summary, we can show how integrating the SDGs into government bond strategies can help further the goals, despite the challenges posed by a small universe of investable countries. Such an approach can support countries to access financing, close the SDG financing gap, and foster positive sustainable development outcomes.
This article is an excerpt of a special topic in our five-year outlook.
Important information
THIS WEBSITE IS SOLELY INTENDED FOR PROFESSIONAL INVESTORS, WHICH HAS THE MEANING ASCRIBED TO IT IN THE SECURITIES AND FUTURES ORDINANCE (CAP. 571 OF THE LAWS OF HONG KONG) AND ITS SUBSIDIARY LEGISLATION. Investment involves risks. Past performance is not indicative of future performance. The information contained in this website is provided for reference only and does not constitute investment advice or an offer or solicitation to buy or sell in any securities or to adopt any investment strategy. Investors should not base their investment decisions solely on the information provided on this website and are advised to seek independent advice (including advice on tax implications) before making any investment decisions. Investors should ensure they fully understand the risks associated with the investment products and should also consider their own investment objectives and risk tolerance level. The investment decision is yours. You should not invest unless the intermediary who sells you the investment products has advised you that it is suitable for you and has explained how it is consistent with your investment objectives. Please refer to the relevant offering documents or other legal documents for further details including the risk factors. This website is published by Robeco Hong Kong Limited which is regulated by the Hong Kong Securities and Futures Commission (“SFC”) (CE No. APU851). This website has not been reviewed by the SFC. No assurance can be given that the investment objective of any investment products will be achieved. No representation or promise as to the performance of any investment products or the return on an investment is made. The value of investments may fluctuate. Past performance, projections, or forecasts included in this website should not be regarded as guarantees or indications of future performance, and no express or implied warranty is provided. The contents of this website are based on sources believed to be reliable, but due to the nature of information delivery technology and the necessity of using multiple data sources, including third party content, their accuracy is not guaranteed. The opinions expressed are as of the date shown above and may change as market conditions evolve, and are subject to change without notice. These opinions may differ from those of other Robeco investment professionals. Robeco accepts no liability for any direct, indirect, or consequential loss arising from the use of this material or any comments, opinions, or estimates contained herein. Robeco has no duty to update this website or any website content. Materials on this website may not be reproduced, distributed, or published without prior written permission from Robeco. Unless otherwise specified, Source: Robeco.