
Beyond Fama-French: alpha from short-term signals
Positive net alpha from established short-term signals can be harvested practically by investors. This can be achieved by combining signals for diversification benefits and using efficient trading rules. Moreover, the alpha is uncorrelated to traditional Fama-French factors.
Summary
- Short-term signals are dismissed too easily on transaction cost concerns
- Low correlations between short-term signals highlight diversification opportunities
- Issues regarding high turnover can be countered by a trading cost mitigation approach
Classic factors such as investment, profitability, size and value are typically used in asset pricing models to describe the cross-section of stock returns. By nature, they have low turnovers and their premiums are expected to materialize over multi-year periods. In the short run, however, they can experience large and prolonged drawdowns.
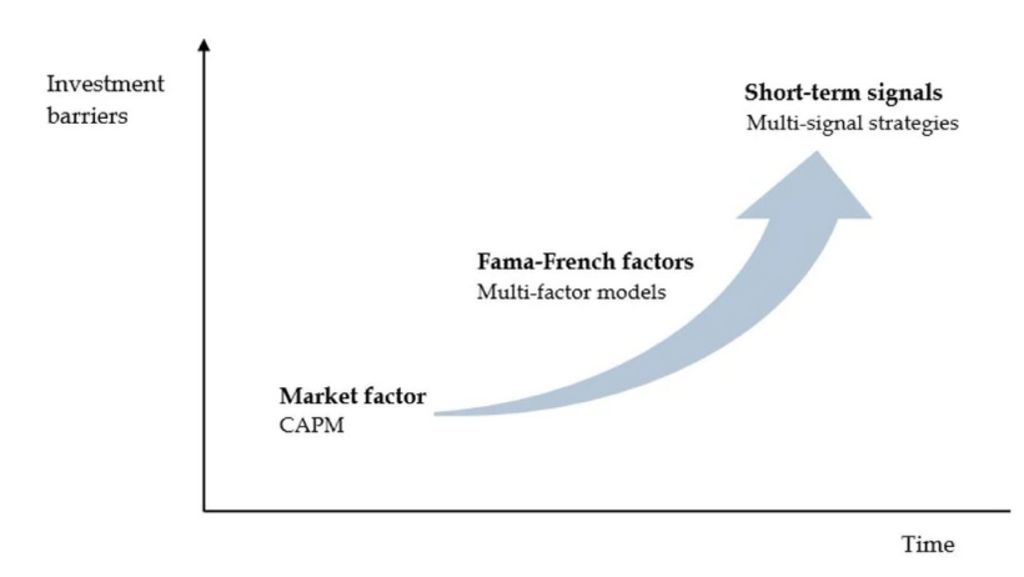
On the other hand, high-turnover anomalies are generally dismissed in the academic literature due to transaction cost concerns. These short-term signals typically provide a string of small consecutive alphas from entirely different portfolios every month, rather than capturing large premiums over a long period. But the alpha is generally considered to be out of reach for investors after accounting for market frictions. In Figure 1 we show conceptually how short-term signals relate to common factors.
Figure 1 | Beyond Fama-French factors

Source: Robeco
In our new study,1 however, we argue that short-term signals are dismissed too easily for several reasons. First, the standard academic factor-construction methodology allocates a disproportionately large weight to small-cap stocks. Since trading costs are much higher for small illiquid stocks than for their large liquid peers, it may be more efficient to apply short-term strategies only to those where the expected gains outweigh the expected costs.
Second, gross and net performance can be improved substantially by shifting the focus from a single signal to a combination of them. Diversification benefits can be derived this way, potentially resulting in higher gross returns and lower volatility.
Third, many studies consider a naïve trading strategy by simply constructing fully fresh top and bottom portfolios every month. In fact, more advanced buy-and-sell rules, which only replace stocks if their attractiveness drops below a certain threshold, achieve savings in trading costs that readily outweigh the loss in gross returns.
Established short-term signals and efficient trading rules
In our research, we looked at a sample period from December 1985 to December 2021 and considered all MSCI World Index constituents, thus excluding all small-cap and off-benchmark stocks. We focused on five short-term signals that are established in the literature:
industry-relative reversals,2
one-month industry momentum,3
analyst earnings revisions over the past 30 calendar days,4
same month stock return effect,5
and one-month idiosyncratic volatility.6
We also created a composite signal that combined all five.
For our analysis, we built equally weighted quintile portfolios by ranking stocks on their signal scores at the end of every month, and then computing the returns of the quintile portfolios over the subsequent month. In terms of an efficient trading strategy, we followed the trading cost mitigation approach outlined in two publications,7 where the long (short) portfolio consists of the stocks that currently belong to the top (bottom) X%, plus the stocks selected in previous months that are still among the top (bottom) Y% of stocks.
For each of the individual and composite signals, we computed the mean returns as well as the CAPM and Fama-French six-factor alphas. The six Fama-French factors are market, size, value, investment, profitability and momentum. In order to assess the net profitability of the signals, we worked out the break-even trading cost levels, defined as the average trading costs at which the six-factor alpha becomes zero. We also arrived at a conservative estimate of real-life trading costs of around 25 basis points (bps).
Individual short-term signals deliver significant alpha
The top-minus-bottom quintile individual short-term signals delivered annualized average returns of between 5% and 8% which were statistically significant, aside from the one-month idiosyncratic volatility signal. This was due to its negative market beta given that it is structurally long low-risk stocks and short high-risk stocks. The CAPM alphas ranged between 6% and 10% per annum and were statistically significant. Meanwhile, the six-factor alphas varied between 6% and 8% on an annual basis and were also statistically significant for most of the short-term signals as their loadings on the Fama-French factors tend to be small.
The largely unique alpha that is generated by short-term signals does, however, come at the cost of a very high turnover, which is between 1,300% and 2,000% per annum. This has major consequences because the break-even trading cost levels for retaining positive alphas are all below 25 bps. This confirms the notion that short-term signals are hard to exploit profitably after costs – at least when considered individually and with a naïve trading strategy.
Composite short-term signal produces even more promising results
The good news is that the correlations between the returns of the different short-term signals were generally low or even negative. This finding suggested that a combination of the short-term signals could offer strong diversification benefits. As such, we proceeded to examine the performance of the short-term composite strategy and found a decreasing pattern of returns from the top-quintile portfolio to the bottom-quintile portfolio.
The resulting top-minus-bottom quintile portfolio delivered a statistically significant average annualized return and CAPM alpha of more than 12% and 14%, respectively. These results were stronger than for the individual signals, thus confirming the power of diversification. At over 12%, the six-factor alpha was also statistically significant, implying that the Fama-French factors cannot explain the alpha of the combined signals.
The turnover remained high at close to 1,800% per annum. However, the break-even trading costs now exceeded 30 bps thanks to the stronger performance of the composite signal. This implies that the multi-signal strategy can generate modest after-cost profits, particularly if investors are able to execute their trades below this conservative threshold.

Active Quant: finding alpha with confidence
Blending data-driven insights, risk control and quant expertise to pursue reliable returns.
Efficient trading strategy can boost net alpha
We then applied the trading cost mitigation approach to the composite strategy. Every month the long (short) portfolio consisted of stocks that currently belonged to the top (bottom) X%, plus the stocks selected in previous months that did not deteriorate beyond the top (bottom) Y%.
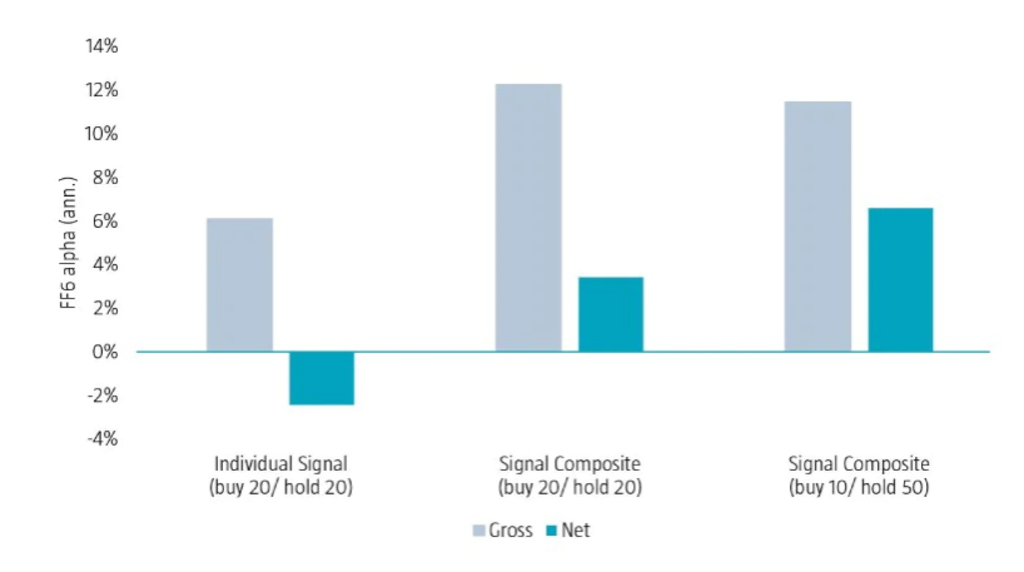
Figure 2 illustrates a summary of our main findings. The first four bars show the average annualized gross and net six-factor alphas for the individual short-term signals and composite signal, applying standard top-minus-bottom quintile (buy 20/hold 20) sorts. The individual short-term signals had an average gross six-factor alpha of more than 6% per annum. However, the high turnover of the signals led to a net alpha of less than -2% when considering realistic transaction costs of 25 bps per single trip. The composite signal boosted the average gross six-factor alpha by 6% to above 12% per year, but transaction costs still eroded more than two-thirds from the net return.
Discover the value of quant
Subscribe for cutting-edge quant strategies and insights.
Figure 2 | Fama-French alphas of short-term signals

Source: Robeco Quantitative Research
The last two bars depict the gross and net six-factor alphas for the short-term composite when applying more advanced buy-and-sell rules (buy 10/hold 50). More specifically, in each month the long (short) portfolio consists of stocks that currently belong to the top (bottom) 10%, plus those selected in previous months that are still among the top (bottom) 50%. These more sophisticated buy-and-sell rules resulted in a slight decrease in the gross alpha for the composite signal, but they lifted the net alpha above 6% thanks to substantially lower turnover.
All in all, these results imply that a composite short-term signal strategy can be highly profitable after costs when efficient trading rules are applied.
Footnotes
1Blitz, D., Hanauer, M. X., Honarvar, I., Huisman, R., and Van Vliet, P., 2022, “Beyond Fama-French: alpha from short-term signals”, SSRN working paper.
2Da, Z., Liu, Q., and Schaumburg, E., 2014, “A closer look at the short-term return reversal”, Management Science; and Hameed, A., and Mujtaba Mian, G., 2015, “Industries and stock return reversals”, Journal of Financial and Quantitative Analysis.
3Moskowitz, T.J., and Grinblatt, M., 1999, “Do industries explain momentum?”, The Journal of Finance.
4Van der Hart, J., Slagter, E., and van Dijk, D., 2003, “Stock selection strategies in emerging markets”, Journal of Empirical Finance.
5Heston, S.L, and Sadka, R., 2008. “Seasonality in the Cross-Section of Stock Returns.” Journal of Financial Economics.
6Ang, A., Hodrick, R.J., Xing, Y., and Zhang, X., 2006. “The Cross-Section of Volatility and Expected Returns.” The Journal of Finance.
7De Groot, W., Huij, J., and Zhou, W., 2012, “Another look at trading costs and short-term reversal profits”, Journal of Banking and Finance; and Novy-Marx, R., and Velikov, M., 2016, “A taxonomy of anomalies and their trading costs.” The Review of Financial Studies.
Important information
The contents of this document have not been reviewed by the Securities and Futures Commission ("SFC") in Hong Kong. If you are in any doubt about any of the contents of this document, you should obtain independent professional advice. This document has been distributed by Robeco Hong Kong Limited (‘Robeco’). Robeco is regulated by the SFC in Hong Kong. This document has been prepared on a confidential basis solely for the recipient and is for information purposes only. Any reproduction or distribution of this documentation, in whole or in part, or the disclosure of its contents, without the prior written consent of Robeco, is prohibited. By accepting this documentation, the recipient agrees to the foregoing This document is intended to provide the reader with information on Robeco’s specific capabilities, but does not constitute a recommendation to buy or sell certain securities or investment products. Investment decisions should only be based on the relevant prospectus and on thorough financial, fiscal and legal advice. Please refer to the relevant offering documents for details including the risk factors before making any investment decisions. The contents of this document are based upon sources of information believed to be reliable. This document is not intended for distribution to or use by any person or entity in any jurisdiction or country where such distribution or use would be contrary to local law or regulation. Investment Involves risks. Historical returns are provided for illustrative purposes only and do not necessarily reflect Robeco’s expectations for the future. The value of your investments may fluctuate. Past performance is no indication of current or future performance.


