Researcher


• Insight
Using artificial intelligence for selecting small-cap stocks
Amid an ever-changing economic environment, small-cap equities present an equity sub-asset class that historically attracted flows in global large-cap market environments. In this insight of our special topic as part of our 5-year Expected Returns, our quant researchers Tobias Hoogteijling, Vera Roersma and Matthias Hanauer talk about how small caps are coming back into the spotlight.
Authors


Researcher



Researcher
Summary
- Small-cap indices represent a more diversified, cheaper universe
- Sparse analyst coverage means a fertile ground for quant
- AI and machine learning can offer alpha by capturing complex relationships
Small-cap stocks are publicly traded companies with market capitalizations typically ranging between USD 250 million and USD 10 billion.1 Small caps are an integral part of the global equity market portfolio, and many consider explicit allocation to them. “This is especially the case in today’s markets, where mega-cap tech stocks dominate large-cap indices, which also trade at elevated valuations,” says Hanauer. In contrast, small-cap indices comprise a much wider and more diversified mix of stocks, trading at a discount of approximately 20% compared to large caps.
The small-cap universe presents attractive alpha opportunities for investors who know where to find them, but also sizable challenges due to its broad and heterogeneous nature. Human analysts can only cover a limited number of names, and the more niche nature of small-cap firms makes specialization more difficult. 2
Sparse coverage means alpha opportunities
For example, on average, each small-cap stock is currently covered by about eight analysts, compared to 19 for large-cap stocks.3 Although fundamental managers might struggle to cover the investable small-cap universe, it fits naturally into a quantitative approach, as the cost of developing a quantitative model does not increase with the investable universe’s size. Conversely, as Roersma points out, quantitative strategies actually benefit from the universe’s breadth, from which they can systematically exploit a broad set of opportunities.
The small-cap universe’s size, diversity and complexity make it difficult for analysts and fundamental investors to cover it thoroughly. Its resulting market inefficiency and mispricing, however, can create larger opportunities to generate alpha. This greater degree of mispricing can be observed empirically, for example, by analyzing hypothetical top-minus-bottom portfolios based on well-known stock market factors such as value, momentum, and quality. Figure 1 illustrates that the annualized factor premiums and their corresponding volatilities are higher in the small-cap space than in the large-cap space.
Figure 1: Top-minus-bottom factor premiums in small-cap and large-cap space
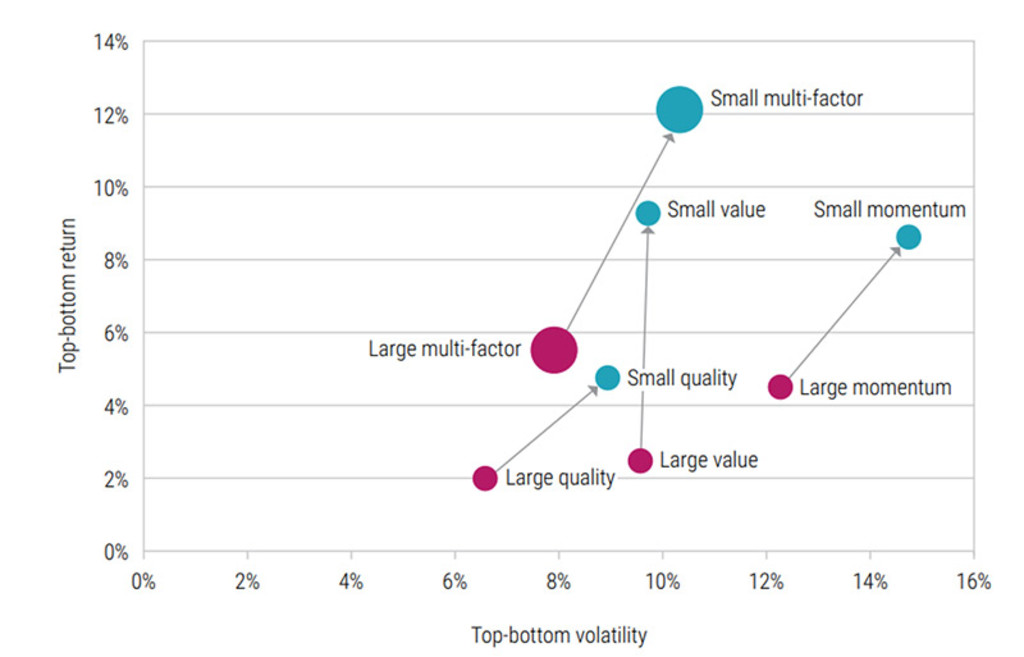
The performance shown is hypothetical, based on theoretical models and assumptions, and is no guarantee for future results. Source: Robeco. The graph reports the annualized returns and volatilities for ‘small’ and ‘large’ cap factors. Factor returns are the return spreads between the top and bottom factor quintile portfolios. Portfolios are equal-weighted and rebalanced monthly. The investment universe consists of the constituents of the MSCI World (‘large’) and MSCI World Small Cap (‘small’) indices. The generic factors are Value (book/price, forward earnings/price), Quality (ROE, debt/assets), and Momentum (12–1 month price momentum). The composite factor is an equally weighted average of Value, Momentum, and Quality. The sample period spans from January 2000 to April 2025.
Predicting stock returns with machine learning
To model such stock market dynamics, we turn to machine learning (ML), a subcategory of AI. In this specific case, says Hoogteijling, we are interested in modeling which stocks are likely to yield high returns (and thus are potential buy candidates) and vice versa. One key advantage of ML techniques is their flexibility in capturing data patterns. In a simpler, traditional approach, one would often assume that relationships are linear. However, not all real-life relationships can be linearly approximated. ML algorithms such as random forests and neural networks4 do not impose such a strict functional form, but instead can be more freely shaped depending on the data given to the model. 5
Discover the value of quant
Subscribe for cutting-edge quant strategies and insights.
Performance of stock selection models
To assess the performance of these ML models – in other words, whether they can accurately predict whether stocks will outperform or underperform – we conduct a historical simulation study classifying the top and bottom half of stocks’ predicted returns. Then, we investigate to what extent the various models can correctly predict these two halves. If a model had no predictive power, about half of the stocks would be correctly predicted.
As illustrated in Figure 2, we find that both a generic factor model and an ML model outperform the ‘no predictability’ benchmark in terms of model accuracy. Furthermore, the ML model outperforms the generic value-quality-momentum factor model. Although stock-specific predictability of around 51-52% might seem low, small but consistent advantages can translate into long-term success. These stock-specific hit ratios translate into portfolio hit ratios of 68% and 78% for long-short quintile portfolios based on monthly returns, when sorted by generic and ML model predictions, respectively. These numbers highlight how even a slight improvement in predictive accuracy can lead to substantially better portfolio outcomes. 6
Figure 2: Average percentage of stocks accurately classified
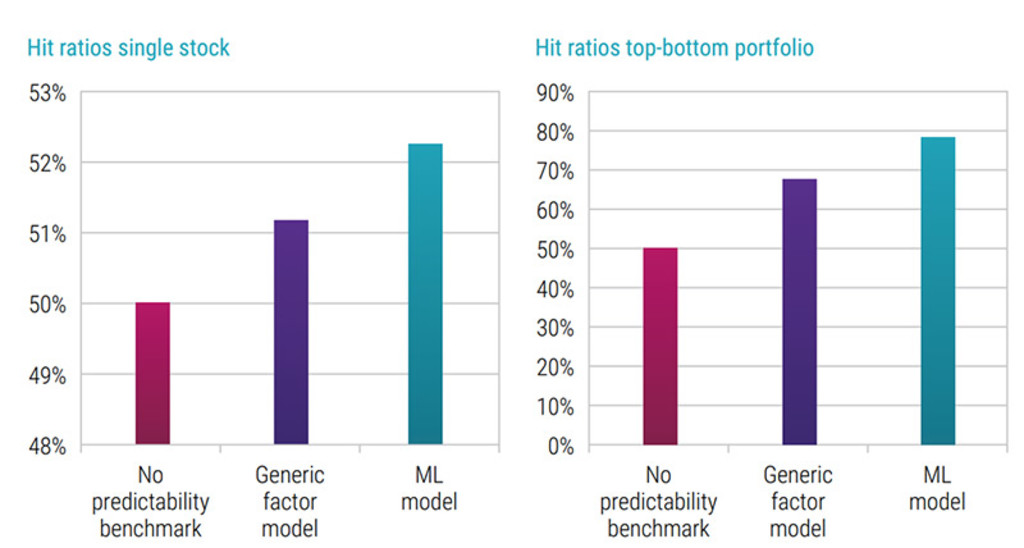
The performance shown is hypothetical, based on theoretical models and assumptions, and is no guarantee for future results. Source: Robeco. The figure on the left shows the time series’ average percentage of stocks correctly classified as being in the top half or bottom half of stocks in terms of next month returns, in a historical simulation study. The figure on the right shows the hit ratio of monthly long-short quantile portfolio returns, sorted based on predicted returns. The considered universes are the constituents of the MSCI World Small Cap Index over the period December 2000 to April 2025. The generic factor model consists of generic Value (book/price and forward earnings/price), Quality (ROE and debt/assets) and Momentum (12-1 month price momentum) factors.
Conclusion
In recent years, AI has shifted from hype to practical application, with machine learning in particular showing real promise for quantitative investing. Small-cap equities, with their breadth, inefficiencies, and limited coverage, offer especially fertile ground for these techniques.
Yet, as Hoogteijling explains, AI is not a silver bullet: success depends on careful model selection, interpretation, and explainability. When used with skill and discipline, however, machine learning can be a powerful addition to the quant investor’s toolkit, and a source of enduring edge in small-cap markets.
This article is an excerpt of a special topic in our five-year outlook.
Footnotes
1 As of the end of April 2025, based on the market capitalization numbers for the constituents of the MSCI World Small Cap Index, winsorized at the top and bottom 2.5%.
2 As of the end of April 2025, based on four bottom-up-calculated multiples (price-to-book, forward price-to-earnings, price-to-earnings, and price-to-dividend) for the MSCI World and MSCI World Small Cap indices.
3 Source: IBES.
4 A neural network is a type of ML model that learns to recognize patterns, inspired by how the human brain processes information. A random forest is a group of simple decision-making models (called decision trees) that work together to make more accurate choices than just one tree on its own.
5 For a broader view of the different applications of ML in asset management, we refer to Blitz et al. (2023) and Chen and Zhou (2023).
6 The performance shown is hypothetical, based on theoretical models and assumptions, and is no guarantee for future results.

Expected Returns 2026 - 2030
Important information
THIS WEBSITE IS SOLELY INTENDED FOR PROFESSIONAL INVESTORS, WHICH HAS THE MEANING ASCRIBED TO IT IN THE SECURITIES AND FUTURES ORDINANCE (CAP. 571 OF THE LAWS OF HONG KONG) AND ITS SUBSIDIARY LEGISLATION. Investment involves risks. Past performance is not indicative of future performance. The information contained in this website is provided for reference only and does not constitute investment advice or an offer or solicitation to buy or sell in any securities or to adopt any investment strategy. Investors should not base their investment decisions solely on the information provided on this website and are advised to seek independent advice (including advice on tax implications) before making any investment decisions. Investors should ensure they fully understand the risks associated with the investment products and should also consider their own investment objectives and risk tolerance level. The investment decision is yours. You should not invest unless the intermediary who sells you the investment products has advised you that it is suitable for you and has explained how it is consistent with your investment objectives. Please refer to the relevant offering documents or other legal documents for further details including the risk factors. This website is published by Robeco Hong Kong Limited which is regulated by the Hong Kong Securities and Futures Commission (“SFC”) (CE No. APU851). This website has not been reviewed by the SFC. No assurance can be given that the investment objective of any investment products will be achieved. No representation or promise as to the performance of any investment products or the return on an investment is made. The value of investments may fluctuate. Past performance, projections, or forecasts included in this website should not be regarded as guarantees or indications of future performance, and no express or implied warranty is provided. The contents of this website are based on sources believed to be reliable, but due to the nature of information delivery technology and the necessity of using multiple data sources, including third party content, their accuracy is not guaranteed. The opinions expressed are as of the date shown above and may change as market conditions evolve, and are subject to change without notice. These opinions may differ from those of other Robeco investment professionals. Robeco accepts no liability for any direct, indirect, or consequential loss arising from the use of this material or any comments, opinions, or estimates contained herein. Robeco has no duty to update this website or any website content. Materials on this website may not be reproduced, distributed, or published without prior written permission from Robeco. Unless otherwise specified, Source: Robeco.