Researcher


• Visie
Quant chart: alternative peer groups
We use data on analyst coverage to identify firms followed by the same analysts and categorize them as being related peers. From this we can then create a network of connected companies. This is because our research1 shows that standard sector or industry classifications can be a crude proxy for determining fundamentally linked companies.
Auteurs


Client Portfolio Manager
Identifying which stocks are peers of each other is of great importance to financial research and applications because it allows for an apples-to-apples comparison of companies and the potential exploitation of information spillover effects. The traditional way of grouping similar firms together is based on standard sector or industry classifications such as GICS or SIC codes. While these are useful as a starting point, they sometimes fail to spot homogenous groups of fundamentally related companies.
For instance, Apple and HP are both in the technology hardware and equipment retailing industry group and are arguably economically linked firms. Apple, on the other hand, is also part of the FAANG collection of stocks, but it falls within a different industry group or even sector compared to its Silicon Valley counterparts.2
Alternative peer groups have been proposed in the academic literature based on firms in the same geographic region,3 customer-supplier data,4 textual similarities in companies’ 10-K business descriptions,5 or comparable technologies based on patent data.6
More recently, Ali and Hirshleifer illustrated the efficacy in linking peers based on shared analyst coverage.7 This approach could be superior for several reasons. Firstly, the shared analyst network makes use of analysts’ human intelligence. Not only is it the analyst’s job to gather all relevant information about fundamentals such as information about related firms, customers, suppliers and competitors; an analyst is also more likely to adapt to changing market conditions than relatively static industry classifications.
Secondly, analyst linkages can uniquely identify connected company pairs rather than linking all firms within a sector, industry or a region. Similarly, analysts can also determine linkages beyond industry and geographic classifications, meaning that a company can be linked to firms both within its own but also outside its sector. Thirdly, the number of shared analysts can serve as a proxy for the strength of the relationship because not all relationships within the same region or sector will be equally important.
Figure 1 | Analyst-based company network for Apple
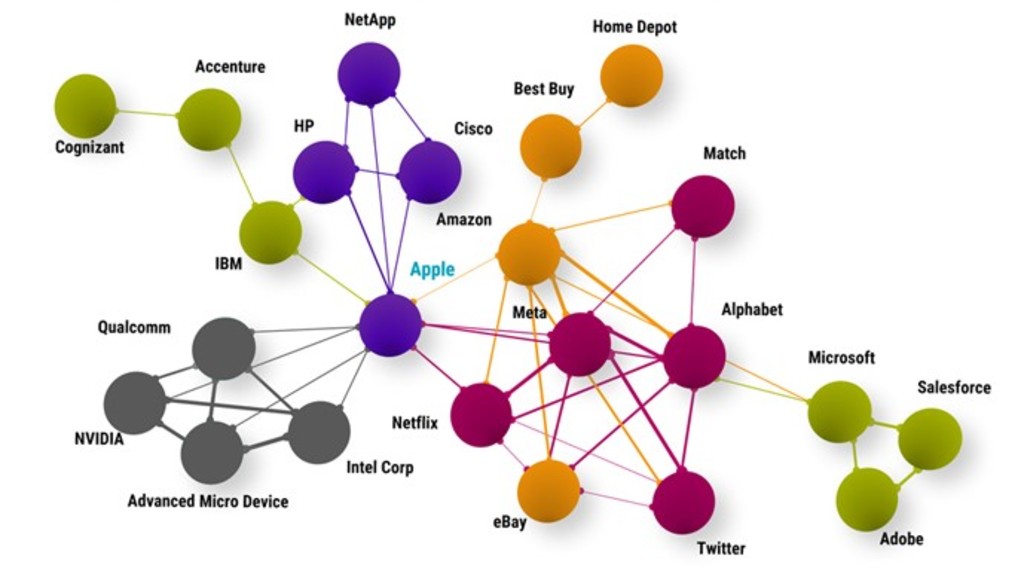
Source: I/B/E/S, Refinitiv, Robeco. For illustrative purposes only. The figure shows a simplified analyst network of connected firms for Apple as of September 2022. Two firms are connected when the same analyst covers them. The more analysts cover a pair of stocks, the thicker the line between them. The different colors indicate different GICS industry groups.
Figure 1 visualizes the connected company networks based on shared analyst coverage for Apple. The different colors represent different GICS industry groups. Classic information technology firms such as HP (technology hardware and equipment, purple), IBM (software and services, green) and Intel (semiconductors and semiconductor equipment, grey) are connected with Apple via shared analysts. However, we also observe that FAANG stocks from other sectors such as Meta Platforms, Alphabet, Netflix (all media and entertainment, pink) and Amazon (retailing, orange) are also closely related to Apple.
Therefore, we can conclude that the shared analyst coverage approach is an alternative and adaptive way to identify relevant firm peers.
Footnotes
1 Hanauer M. X., and Huisman R., October 2022, “Shared analyst momentum: extracting signals from connected company networks”, Robeco article.
2 Meta Platforms (formerly known as Facebook), Netflix and Alphabet (formerly known as Google) are in the ‘media and entertainment industry group which falls under the communication services‘ sector. Amazon is in the retailing industry group which falls under the consumer discretionary sector.
3 Parsons, C. A., Sabbatucci, R., and Titman, S., October 2020, “Geographic lead-lag effects ”, Review of Financial Studies.
4 Cohen, L., and Frazzini, A., August 2008, “Economic links and predictable returns”, Journal of Finance.
5 Hoberg, G., and Phillips, G., October 2010, “Product market synergies and competition in mergers and acquisitions: a text-based analysis” The Review of Financial Studies; and Hoberg, G., and Phillips, G., October 2016, “Text-based network industries and endogenous product differentiation” Journal of Political Economy.
6 Bloom, N., Schankerman, M., and Van Reenen, J., July 2013. “Identifying technology spillovers and product market rivalry”, Econometrica; and Lee, C., Sun, S. T., Wang, R., and Zhang, R., June 2019, “Technological links and predictable returns”, Journal of Financial Economics.
7 Ali, U., and Hirshleifer, D., June 2020, “Shared analyst coverage: unifying momentum spillover effects”, Journal of Financial Economics.