Senior Sales Manager Belgium & Luxembourg


• Insight
There’s no quant crisis in credits
Quant strategies have performed well in credits. This is in contrast to quant equities, where strategies exposed to the value factor have struggled.
Authors






Head of Quant Fixed Income and Lead Portfolio Manager
Summary
- Quant strategies have performed well in credits, unlike in equities
- Value factor in credits unaffected by outperformance of big tech
- Multi-factor portfolios in credit and equity have a low correlation
Quant equity strategies, hedge funds and alternative risk premia strategies have struggled in recent years to keep up with markets, with strategies exposed to the value factor being hit particularly hard. Not surprisingly, then, terms such as ‘quant quake’ and ‘quant crisis’ were coined to label this period of underperformance in quant strategies. The positive performance of quant credit strategies during this period seems to have received less attention, though. Remarkably, the value factor was the main driver of the outperformance in the credit market. In this article we explain in more detail why value did not struggle in credits – and, consequently, why there is no quant crisis in credits.
Most quant or factor-based equity strategies have exposure to the value factor. Value investing is the best-known and oldest investment style, and the value premium has been documented in numerous academic studies. Attractively valued stocks are typically those of mature companies in traditional business sectors that are less popular among investors. Although value stocks have historically outperformed growth stocks, the experience in recent years has been completely different: the incredible returns generated by a handful of very large growth companies in the technology sector have dominated the market’s average return and boosted stock market indices to all-time highs.
To illustrate, the cumulative total return of the FAANG stocks1 over the last five years was a staggering 280%, compared to 78% for the broad MSCI World Index, which would have been 11 percentage points lower without the FAANG stocks. From a valuation perspective, big tech stocks were unattractive as they were trading at expensive multiples such as the traditional price-to-book ratio. They were therefore not selected in value portfolios. Portfolios without big tech stocks clearly lagged their benchmarks, and so did most quant equity strategies that employed the value factor in their investment process. Outperforming equity factors like profitability and momentum failed to offset the losses of the value factor2.
Get the latest insights
Subscribe to our newsletter for investment updates and expert analysis.
No big tech dominance in credits
The dominance of big tech firms in the equity market does not exist in credits. While the high returns of big tech stocks may have been justified by the theoretically unlimited upside potential in future revenues for equity investors, bond returns were much lower because bond holders are left with just fixed coupons and repayment of the bond’s notional value. We illustrate this in Figure 1, in which we compare the return of an investment in an Apple stock and an Apple bond over the 2016-2020 period. The cumulative return of the Apple stock was 453%, compared with 28% for the bond.
Figure 1 | Apple stock and bond return
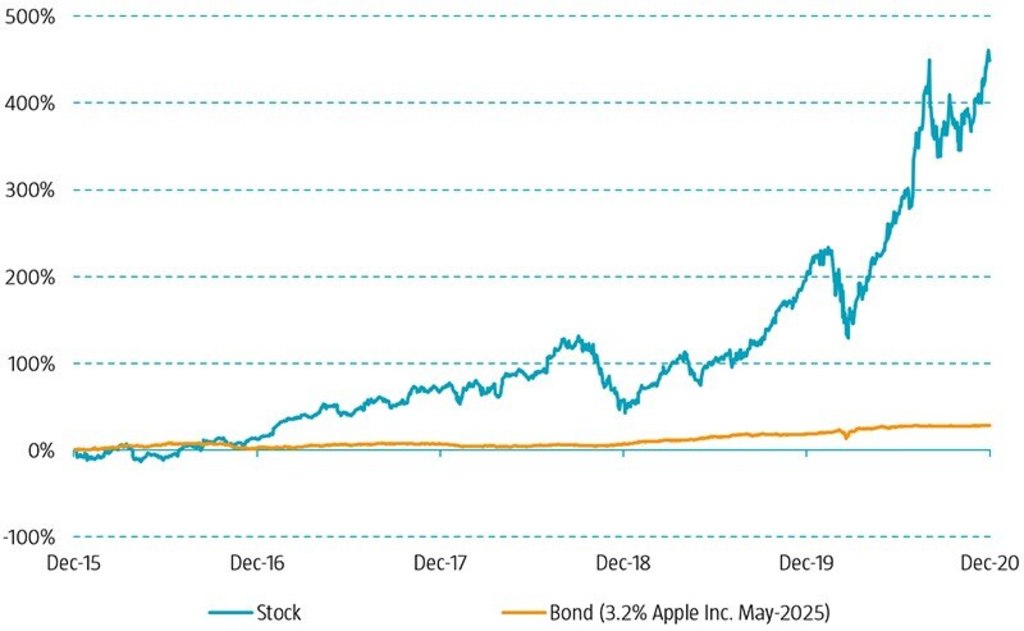
Source: Bloomberg. Apple stock return in USD based on closing prices adjusted for dividends and stock splits. Apple bond return is the total return in USD including coupons.
Due to the extreme rally of big tech stocks, the weight of the technology sector in the MSCI World index also grew rapidly, from 14% at the end of 2015 to 22% at the end of 2020, amplifying their dominance in equity index returns. In short, tech stocks were already big and expensive in 2015, but due to their strong performance they only got bigger and more expensive over the past few years.
By contrast, the returns of big tech firms had much less of an impact on credit index returns. This is not only because the bond returns were much lower than the equity returns, but also because the weight of these firms in the credit index was much smaller. Big tech firms did not issue a lot of bonds as they could more cheaply finance their acquisitions with stocks or cash. To illustrate, the total weight of Apple, Microsoft, Amazon, Facebook, Alphabet and Tesla in the credit market is only 1.5%, while these six companies represent almost 15% of the global equity market.
Value in credits
We see that value in equities struggled, mainly due to missing out on the staggering returns of big tech companies, and that big tech did not dominate in terms of returns and market weight in credits. So how did value perform in credits?
Remarkably, value was the best-performing factor in the credit market over the past five years compared to other well-known factors such as low-risk, quality, momentum and size. How can the strong performance of value in credits be explained? In short, value prefers bonds that are attractively priced and thus have above-average credit spreads compared to other bonds with the same risk profile. Such bonds generally perform strongest when credit markets compress and deliver positive credit returns, while the low-risk factor does better when credit returns are negative, as it prefers bonds and issuers that are safer than average. In recent years, credit markets generally posted positive credit returns, supported by the ongoing search for yield and central bank corporate bond buying programs. In this environment, value performed strongly.
In terms of the value factor’s preferences in the credit market, we find that it actually had a modest preference for the technology sector on average over the last five years. So, bonds from tech firms on average carried somewhat attractive risk premiums given their credit risk and given the credit spreads of similarly risky bonds. This contrasts sharply with the unattractive valuations of tech firms in the equity market and the underweight in many quant equity strategies. Robeco’s Multi-Factor Credits strategy did have overweigh
t positions in tech companies. Next to the somewhat attractive valuations, the overweights were mainly driven by the low-risk/quality and momentum factors that appreciated their characteristics of – on average – solid balance sheets, attractive profitability and strong equity market momentum. The divergent relative performance of multi-factor portfolios in equities and credits is not a surprise. Previous research shows that the two only have a 17% correlation.
Footnotes
1 The weighted average total return in USD of a group of big tech firms: Facebook, Apple, Amazon, Netflix and Alphabet (Google) over the period January 2016 to December 2020.
2 For more insights we refer to the article “The quant equity crisis of 2018-2020: Cornered by big growth” by David Blitz, published in February 2021.
Important information
THIS WEBSITE IS SOLELY INTENDED FOR PROFESSIONAL INVESTORS, WHICH HAS THE MEANING ASCRIBED TO IT IN THE SECURITIES AND FUTURES ORDINANCE (CAP. 571 OF THE LAWS OF HONG KONG) AND ITS SUBSIDIARY LEGISLATION. Investment involves risks. Past performance is not indicative of future performance. The information contained in this website is provided for reference only and does not constitute investment advice or an offer or solicitation to buy or sell in any securities or to adopt any investment strategy. Investors should not base their investment decisions solely on the information provided on this website and are advised to seek independent advice (including advice on tax implications) before making any investment decisions. Investors should ensure they fully understand the risks associated with the investment products and should also consider their own investment objectives and risk tolerance level. The investment decision is yours. You should not invest unless the intermediary who sells you the investment products has advised you that it is suitable for you and has explained how it is consistent with your investment objectives. Please refer to the relevant offering documents or other legal documents for further details including the risk factors. This website is published by Robeco Hong Kong Limited which is regulated by the Hong Kong Securities and Futures Commission (“SFC”) (CE No. APU851). This website has not been reviewed by the SFC. No assurance can be given that the investment objective of any investment products will be achieved. No representation or promise as to the performance of any investment products or the return on an investment is made. The value of investments may fluctuate. Past performance, projections, or forecasts included in this website should not be regarded as guarantees or indications of future performance, and no express or implied warranty is provided. The contents of this website are based on sources believed to be reliable, but due to the nature of information delivery technology and the necessity of using multiple data sources, including third party content, their accuracy is not guaranteed. The opinions expressed are as of the date shown above and may change as market conditions evolve, and are subject to change without notice. These opinions may differ from those of other Robeco investment professionals. Robeco accepts no liability for any direct, indirect, or consequential loss arising from the use of this material or any comments, opinions, or estimates contained herein. Robeco has no duty to update this website or any website content. Materials on this website may not be reproduced, distributed, or published without prior written permission from Robeco. Unless otherwise specified, Source: Robeco.