Effective October 29th 2020, selected RobecoSAM equity funds were merged onto the RCGF SICAV platform and received new inception dates, share classes, and ISIN codes.
More informationFund | Reference index | |
---|---|---|
1 month | ||
3 months | ||
YTD | ||
1 year | ||
2 years | ||
3 years | ||
5 years | ||
10 years | ||
{{'fund.detail.performance.period.sinceInception' | labelize:[ fundDate(fund.fundPerformances.sinceStart.startDate,'MM-YYYY') ]}} |
Fund | Reference index | |
---|---|---|
Based on transaction prices, the fund's return was 7.59%. Due to its defensive nature, the portfolio underperformed the benchmark. Its value increased significantly, but in the current risk-on environment, the focus on stability and quality was not fully rewarded. The best performance contribution was made by Zebra Technologies. The US company that manufactures barcode scanners, RFID devices and software to track inventories reported excellent quarterly numbers. Zebra benefited from a global acceleration in e-commerce. Companies associated with clean energy, including utilities (Northland Power) and industrials (Schneider Electric) strongly benefited from global commitments to ‘Green Deals’. On the negative side, the rebound in the above value sectors came with a quite negative impact on performance. Energy, and especially consumer discretionary, that only has a small weight in the portfolio, rallied on expectations that economic growth is set to accelerate. The financials stocks held in the portfolio all performed well. Nevertheless, the sector contribution was negative as many other banks and insurers, predominantly those with depressed capital resources, doubled in valuation.
3 years | 5 years | ||
---|---|---|---|
Tracking error ex-post (%) |
|
||
Information ratio | |||
Sharpe ratio | |||
Alpha (%) | |||
Beta |
|
||
Standard deviation |
|
||
Max. monthly gain (%) |
|
||
Max. monthly loss (%) |
|
3 years | 5 years | ||
---|---|---|---|
Months outperformance | |||
Hit ratio (%) | |||
Months Bull market | |||
Months outperformance Bull | |||
Hit ratio Bull (%) | |||
Months Bear market | |||
Months outperformance Bear | |||
Hit ratio Bear (%) |
Fund | Reference index | ||
---|---|---|---|
Rating | |||
Option Adjusted Modified Duration (years) | |||
Maturity (years) | |||
Yield to Worst (%) | |||
Green Bonds (%) |
With a gain of nearly 13% (in USD), November became the best month for the MSCI World Index this year. However, unlike previous months, it was not the big technology stocks that boosted markets to new highs, but the traditional value sectors such as energy, industrials and financials. A vigorous rotation from the winners of the crisis to sectors that were left behind helped the latter to realize historic gains. The optimism was triggered by two factors. First, the US elections that ended with a win for Joe Biden for the presidency and a Senate that will likely keep its Republican majority (Georgia still needs runoff elections). This ‘gridlock’ outcome raised expectations for further fiscal stimulus to follow soon, but without Biden’s proposed tax increases. The nomination of Janet Yellen as the new Treasury Secretary was also well received by investors. And second, several pharmaceutical companies have announced a breakthrough in the production of a vaccine against coronavirus. With emergency approval by the FDA and its European counterpart, the vaccine should now be made available as quickly as possible.
Name | Sector | Weight |
---|---|---|
Yes | No | N/A | ||
---|---|---|---|---|
Voting | ||||
Engagement | ||||
ESG integration | ||||
Exclusion |
Yes | No | N/A | ||
---|---|---|---|---|
Screening | ||||
Integration | ||||
Sustainability Themed Fund |
The fund is allowed to pursue an active currency policy to generate extra returns and can engage in currency hedging transactions.
In principle the fund does not intend to distribute dividend and so both the income earned by the fund and its overall performance are reflected in its share price.
RobecoSAM Global SDG Equities invest in companies whose products and services create a positive impact on the SDGs. It employs systematic, bottom-up stock selection that combines proprietary Environmental, Social & Governance (ESG) data and research throughout the investment process. ESG criteria for exclusions and theme-specific suitability are applied during universe construction. An in-house Sustainability Investing (SI) research team integrates financially-material sector and company-specific sustainability analysis into investment cases. A dedicated thematic equity team incorporates SI research within fundamental analysis and stock valuations. Impact assessments of controversial incidences affecting portfolio holdings provide additional risk management. An active ownership and engagement team interacts directly with company management of fund holdings, offering additional channels for sustainable impact.
Our investment philosophy is grounded in the core belief that the integration of ESG factors into a disciplined, research-driven investment process leads to better-informed investment decisions and better risk-adjusted returns through an economic cycle. Building on our proprietary data and research, we identify companies that generate a competitive advantage through sound business practices, efficiency improvements, and the creation of new solutions for the myriad challenges facing society over the coming decades. Taking a long-term investment perspective, we analyze companies’ business models, market positioning and growth potential, and evaluate their financial performance and valuation. Based on this fundamental assessment, we seek to uncover attractive investment opportunities and implement them in concentrated, conviction-based equity portfolios.
Risk management is fully integrated into the investment process to ensure that positions always meet predefined guidelines.
Investors generally assume a very positive outlook. The so-called Fear & Greed Index, which tries to capture the emotions dominating the current market sentiment now stands at ‘Extreme Greed’. The index is derived from a number of quantitative indicators such as the put/call ratio, with most of them ranging at extraordinary levels. Indeed, there are still many arguments for equities. The supportive monetary and fiscal policy continues to keep interest rates at an artificial low level and provides the economy with an unlimited inflow of fresh money. The availability of a vaccine increases the likelihood that the pandemic can be overcome soon. Nevertheless, the question arises whether the stock markets are not incorporating an overly optimistic scenario and not pricing in the best of all worlds. The overall economic output is still below pre-crisis levels and the current partial lockdowns will weigh on an upswing for quite some time. The gradual ascent back to pre-pandemic levels remains prone to setbacks. We remain constructive on the mid-term to long-term perspectives of the equity markets, but keep a focus on diversification to be better protected against any unforeseen event.
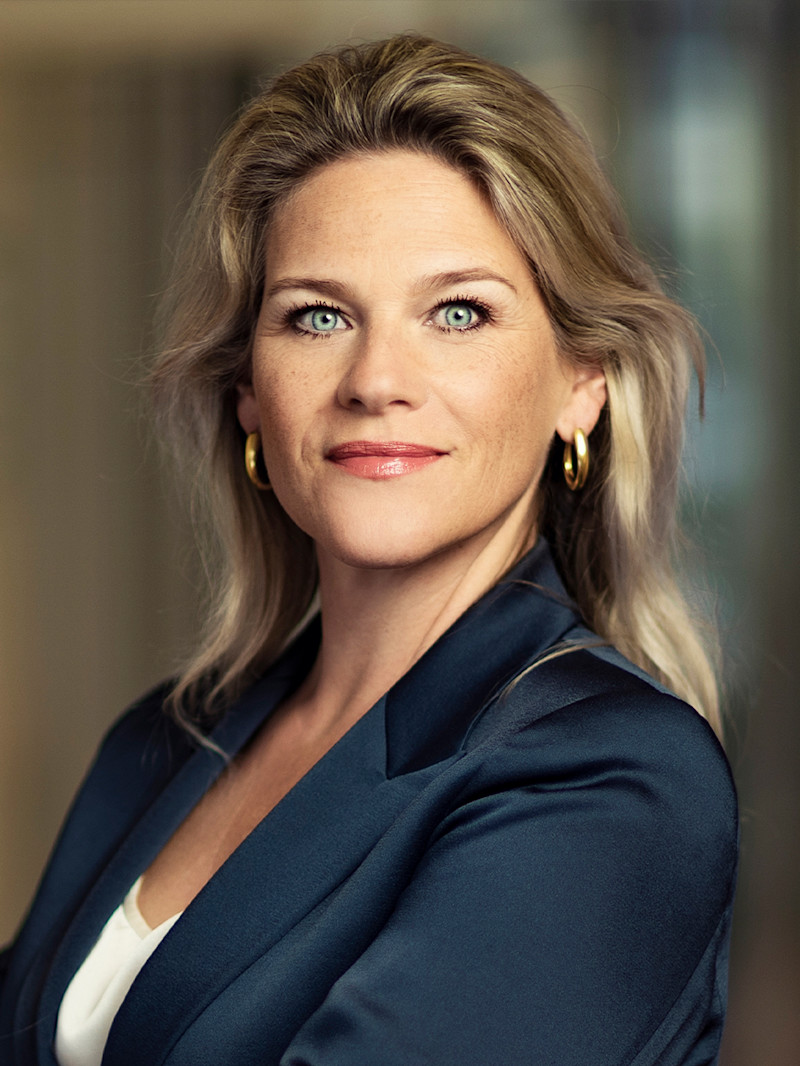
Rainer Baumann is Head of Investments and a Member of the Executive Committee at Robeco Switzerland Ltd. He oversees and manages a team of investment professionals consisting of Portfolio Managers and Equity Analysts. In addition to his management role, he acts as a Portfolio Manager for the Global SDG Equities strategy. Prior to joining the firm, Rainer spent three years with UBS Wealth Management as a Portfolio Manager responsible for large private asset management mandates and as a member of the local investment committee. He began his career in Financial Audit at PricewaterhouseCoopers. Rainer holds a Master's degree in Business Administration from the University of Zurich and is a CFA Charter-holder. He joined Robeco in 2002.
Management company | |
Fund capital | |
Size of share class | |
Outstanding shares | |
ISIN | LU2145460353 |
Bloomberg | RSGSEDE LX |
Valoren | 55777796 |
WKN | A2QD2L |
Availability | |
1st quotation date | 1603929600000 |
Close financial year | 31-12 |
Legal status | |
Tracking error limit (%) | |
Reference index |
Ongoing charges |
|
---|---|
This fund deducts ongoing charges of |
These charges comprise | ||
---|---|---|
Management fee | ||
Service fee |
Transaction costs |
|
---|---|
The expected transaction costs are |
Performance fee |
|
---|---|
This fund may also deduct a performance fee of |
max entry fee | ||
Max exit fee | ||
Max sub fee | ||
Max switch fee |
The fund is established in Luxembourg and is subject to the Luxembourg tax laws and regulations. The fund is not liable to pay any corporation, income, dividend or capital gains tax in Luxembourg. The fund is subject to an annual subscription tax ('tax d'abonnement') in Luxembourg, which amounts to 0.05% of the net asset value of the fund. This tax is included in the net asset value of the fund. The fund can in principle use the Luxembourg treaty network to partially recover any withholding tax on its income.
The fiscal consequences of investing in this fund depend on the investor's personal situation. For private investors in the Netherlands real interest and dividend income or capital gains received on their investments are not relevant for tax purposes. Each year investors pay income tax on the value of their net assets as at 1 January if and inasmuch as such net assets exceed the investor’s tax-free allowance. Any amount invested in the fund forms part of the investor's net assets. Private investors who are resident outside the Netherlands will not be taxed in the Netherlands on their investments in the fund. However, such investors may be taxed in their country of residence on any income from an investment in this fund based on the applicable national fiscal laws. Other fiscal rules apply to legal entities or professional investors. We advise investors to consult their financial or tax adviser about the tax consequences of an investment in this fund in their specific circumstances before deciding to invest in the fund.
Please read this important information before proceeding further. It contains legal and regulatory notices relevant to the information contained on this website.
The information contained in the Website is NOT FOR RETAIL CLIENTS - The information contained in the Website is solely intended for professional investors, defined as investors which (1) qualify as professional clients within the meaning of the Markets in Financial Instruments Directive (MiFID), (2) have requested to be treated as professional clients within the meaning of the MiFID or (3) are authorized to receive such information under any other applicable laws. The value of the investments may fluctuate. Past performance is no guarantee of future results. Investors may not get back the amount originally invested. Neither Robeco Institutional Asset Management B.V. nor any of its affiliates guarantees the performance or the future returns of any investments. If the currency in which the past performance is displayed differs from the currency of the country in which you reside, then you should be aware that due to exchange rate fluctuations the performance shown may increase or decrease if converted into your local currency.
In the UK, Robeco Institutional Asset Management B.V. (“ROBECO”) only markets its funds to institutional clients and professional investors. Private investors seeking information about ROBECO should visit our corporate website www.robeco.com or contact their financial adviser. ROBECO will not be liable for any damages or losses suffered by private investors accessing these areas.
In the UK, ROBECO Funds has marketing approval for the funds listed on this website, all of which are UCITS funds. ROBECO is authorized by the AFM and subject to limited regulation by the Financial Conduct Authority. Details about the extent of our regulation by the Financial Conduct Authority are available from us on request.
Many of the protections provided by the United Kingdom regulatory framework may not apply to investments in ROBECO Funds, including access to the Financial Services Compensation Scheme and the Financial Ombudsman Service. No representation, warranty or undertaking is given as to the accuracy or completeness of the information on this website.
If you are not an institutional client or professional investor you should therefore not proceed. By proceeding please note that we will be treating you as a professional client for regulatory purposes and you agree to be bound by our terms and conditions.
If you do not accept these terms and conditions, as well as the terms of use of the website, please do not continue to use or access any pages on this website.