Robeco Sustainable Global Stars Equities IL GBP
High conviction in the most attractive companies around the world
Share classes
Share classes
Every share class of a product invests in the same portfolio of securities and has the same investment objectives and policies. However, their parameters might deviate. For instance and amongst others, their distribution type, currency exposure or fees and expenses might differ. The most common share classes at Robeco are:
a) D/DH shares, which are regular shares and available for all Investors;
b) I/IH shares, for institutional investors as defined from time to time by the Luxembourg supervisory authority.
For more information on share classes please go to the prospectus.
IL-GBP
D-EUR
Class and codes
Asset class:
Equities
ISIN:
LU2207421723
Bloomberg:
ROGSEIG LX
Index
MSCI World Index (Net Return, GBP)
Sustainability-related information
Under the EU Sustainable Finance Disclosure Regulation, products can be labelled as either Article 6, 8 or 9 fund.
Article 6 - The fund is not in scope of enhanced sustainability disclosures compared to Article 8 and 9.
Article 8 - The fund does not have a sustainable investment objective but promotes environmental or social characteristics and is subject to enhanced sustainability disclosures.
Article 9 - The fund has a sustainable investment objective and is subject to enhanced sustainability disclosures.
Regardless of Article 8 or 9, the companies in which investments are made must follow good governance practices, and sustainable investments must not do any significant harm.
Article 8
- Overview
- Performance & costs
- Portfolio
- Sustainability
- Commentary
- Documents
MISSING: fund.detail.tabs.
Key points
- Concentrated portfolio
- Focuses on companies with a high return on invested capital
- Applies a disciplined approach to valuating companies
About this fund
Robeco Sustainable Global Stars Equities is an actively managed fund that invests in stocks in developed countries across the world. The selection of these stocks is based on fundamental analysis.The fund's objective is to achieve a better return than the index. The fund has a concentrated portfolio of stocks with the highest potential growth which are selected on the basis of high free cash flow, an attractive return on invested capital and a constructive sustainability profile. The fund aims at selecting stocks with relatively low environmental footprints compared to stocks with high environmental footprints.
Key facts
Total size of fund
£ 573,124,432
Size of share class
£ 632,867
Inception date fund
28-07-2020
1-year performance
0.11%
Dividend paying
No
Fund manager
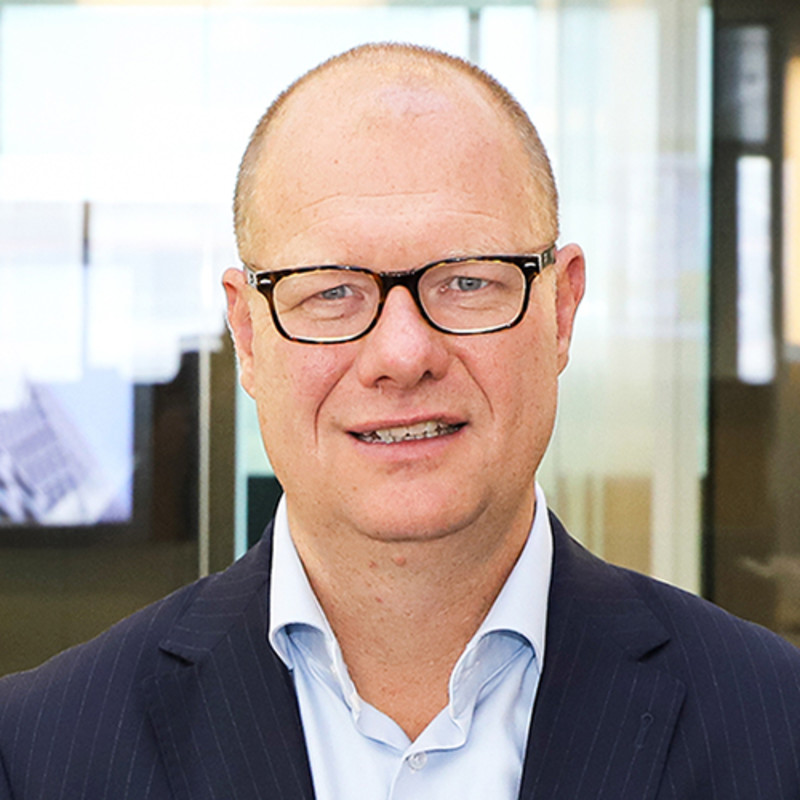
Michiel Plakman CFA
Chris Berkouwer
Michiel Plakman is Lead Portfolio Manager and member of the Global Equity team. He is responsible for fundamental global equities with a focus on SDG investing and on companies in information technology, real estate and portfolio construction. He has been in this role since 2009. Previously, he was responsible for managing the Robeco IT Equities fund within the TMT team. Prior to joining Robeco in 1999, he worked as a Portfolio Manager Japan at Achmea Global Investors (PVF Pensioenen). From 1995 to 1996 he was Portfolio Manager European Equities at KPN Pension Fund. He holds a Master's in Econometrics from Vrije Universiteit Amsterdam and he is a CFA® charterholder. Chris Berkouwer is Lead Portfolio Manager and member of the Global Equity team. He is responsible for fundamental global equities with a focus on the low-carbon transition and on companies in energy, materials and industrials, and portfolio construction. He joined Robeco in 2010. Prior to that, he worked as an analyst for the The Hague Centre for Strategic Studies. He conducted country, industry and company research for various equity teams prior to joining the Global Equity team. He a holds Master's in Business Administration and International Public Management from the Erasmus University Rotterdam.
Performance
1 month
-0.36%
-0.76%
3 months
-3.59%
-1.57%
YTD
2.88%
3.83%
1 year
0.11%
2.70%
2 years
5.82%
8.86%
Since inception 07/2020
8.24%
11.00%
Costs
Ongoing charges
Indication of annual charges that are deducted for this fund. This indication is based on the costs over the last calendar year and may vary from year to year. Transaction costs incurred by the fund, any performance fees and other one-off costs are not included in the ongoing charges.
1.01%
Included management fee
A fee paid by the fund to the asset management company for the professional management of the fund.
0.88%
Included service fee
This fee is intended to cover official fees, such as the cost of annual reports, annual shareholders' meetings and price publications.
0.12%
Transaction costs
The transaction costs shown are the average annual transaction costs over the last three years calculated in accordance with European regulations.
0.20%
Fiscal product treatment
The fund is established in Luxembourg and is subject to the Luxembourg tax laws and regulations. The fund is not liable to pay any corporation, income, dividend or capital gains tax in Luxembourg. The fund is subject to an annual subscription tax ('tax d'abonnement') in Luxembourg, which amounts to 0.01% of the net asset value of the fund. This tax is included in the net asset value of the fund. The fund can in principle use the Luxembourg treaty network to partially recover any withholding tax on its income.
Fiscal treatment of investor
Investors who are not subject to (exempt from) Dutch corporate-income tax (e.g. pension funds) are not taxed on the achieved result. Investors who are subject to Dutch corporate-income tax can be taxed for the result achieved on their investment in the fund. Dutch bodies that are subject to corporate-income tax are obligated to declare interest and dividend income, as well as capital gains in their tax return. Investors residing outside the Netherlands are subject to their respective national tax regime applying to foreign investment funds. We advise individual investors to consult their financial or tax adviser about the tax consequences of an investment in this fund in their specific circumstances before deciding to invest in the fund.
Fund allocation
Asset
Currency
Sector
Top 10
- Asset
- Currency
- Sector
- Top 10
Policies
The fund is allowed to pursue an active currency policy to generate extra returns and can engage in currency hedging transactions.
The fund does not distribute dividend. The fund retains any income that is earned and so its entire performance is reflected in its share price.
Robeco Sustainable Global Stars Equities is an actively managed fund that invests in stocks in developed countries across the world. The selection of these stocks is based on fundamental analysis.The fund's objective is to achieve a better return than the index. The fund aims for a better sustainability profile compared to the Benchmark by promoting certain E&S (i.e. Environmental and Social) characteristics within the meaning of Article 8 of the European Sustainable Finance Disclosure Regulation and integrating ESG and sustainability risks in the investment process and applies Robeco’s Good Governance policy. The fund applies sustainability indicators, including but not limited to, normative, activity-based and region-based exclusions, proxy voting and aims for an improved environmental footprint. The fund has a concentrated portfolio of stocks with the highest potential growth which are selected on the basis of high free cash flow, an attractive return on invested capital and a constructive sustainability profile. The majority of stocks selected will be components of the Benchmark, but stocks outside the Benchmark may be selected too. The fund can deviate substantially from the weightings of the Benchmark. The fund aims to outperform the Benchmark over the long run, whilst still controlling relative risk through the applications of limits (on currencies) to the extent of deviation from the Benchmark. This will consequently limit the deviation of the performance relative to the Benchmark. The Benchmark is a broad market weighted index that is not consistent with the ESG characteristics promoted by the fund.
Risk management is fully integrated into the investment process to ensure that positions always meet predefined guidelines.
Sustainability-related disclosures
Full sustainability-related disclosures
Download full reportSummary sustainability-related disclosures
Download summaryLabels
Febelfin
Febelfin
The fact that the sub-fund has obtained this label does not mean that it meets your personal sustainability goals or that the label is in line with requirements arising from any future national or European rules. The label obtained is valid for one year and subject to annual reappraisal. More information on this label.
Sustainability profile
Environmental footprint
Environmental footprint expresses the total resource consumption of the portfolio per mUSD invested. Each assessed company's footprint is calculated by normalizing resources consumed by the company's enterprise value including cash (EVIC). We aggregate these figures to portfolio level using a weighted average, multiplying each assessed portfolio constituent's footprint by its respective position weight. Sovereign and cash positions have no impact on the calculation. If an index is selected, its aggregate footprint is shown besides that of the portfolio. The equivalent factors that are used for comparison between the portfolio and index represent European averages and are based on third-party sources combined with own estimates. As such, the figures presented are intended for illustrative purposes and are purely an indication. Figures only include corporates The reported waste generation by companies in the portfolio and index can include Incinerated Waste, Landfill Waste, Nuclear Waste, Recycled Waste and Mining Tailing Waste. While these types of waste have different environmental impacts, in the comparison all types of waste are aggregated and expressed as total weight. The difference in tonnes/mUSD invested between portfolio and index is expressed as ‘equivalent to the annual waste generation of # people’, based on the average tonnes of household waste generated per European.


Sustainalytics ESG Risk Rating
The Portfolio Sustainalytics ESG Risk Rating chart displays the portfolio's ESG Risk Rating. This is calculated by multiplying each portfolio component's Sustainalytics ESG Risk Rating by its respective portfolio weight. If an index has been selected, those scores are provided alongside the portfolio scores, highlighting the portfolio's ESG risk level compared to the index. The Distribution across Sustainalytics ESG Risk levels chart shows the portfolio allocations broken into Sustainalytics' five ESG risk levels: negligible (0-10), low (10-20), medium (20-30), high (30-40) and severe (40+), providing an overview of portfolio exposure to the different ESG risk levels. If an index has been selected, the same information is shown for the index. Only holdings mapped as corporates are included in the figures.


Sustainability
The fund incorporates sustainability in the investment process via exclusions, ESG integration, ESG and environmental footprint targets, and voting. The fund does not invest in issuers that are in breach of international norms or where activities have been deemed detrimental to society following Robeco's exclusion policy. Financially material ESG factors are integrated in the bottom-up fundamental investment analysis to assess existing and potential ESG risks and opportunities. In the stock selection the fund limits exposure to elevated sustainability risks. The fund also targets a better ESG score and at least 20% lower carbon, water and waste footprints compared to the reference index. In addition, where a stock issuer is flagged for breaching international standards in the ongoing monitoring, the issuer will become subject to exclusion. Lastly, the fund makes use of shareholder rights and applies proxy voting in accordance with Robeco's proxy voting policy.
Market development
After a euphoric mood at the start of the year, enthusiasm in global equity markets eased somewhat in February (flat in EUR, -2% in USD). Interestingly, better-than-expected macro data during the month underscored the battle on inflation might not be settled yet. Moreover, the much feared recession not yet truly materializing either also means that the end of peak rates is also likely delayed, meaning central banks will keep conditions tight for the time being. With macro still the dominating force of market direction and after the recent equities re-rating, it seems most investors err on the side of caution at this stage. Without any imminent recession, equity drawdown risk might decline too perhaps, hopefully directing investors' focus back towards bottom-up stock picking and credible self-help stories to find alpha. Since we still walk a fine line, navigating a multitude of market anxieties, it is best to sit still or at least remain very selective on where to join in.
Performance explanation
Based on transaction prices, the fund's return was -0.36%. Despite flat absolute returns, in February our strategy outperformed the benchmark from a relative point of view. At the sector level, energy, technology and materials contributed the most to performance, while consumer discretionary and financials lagged during the month. On a stock level, STMicroelectronics again contributed the most, continuing its run after good results and increased guidance. Also, Meta Platforms continued its ascent, with investors rewarding the company changing its tack regarding its overspend on developing the Metaverse and instead focusing on returns. In a slight reversal back into European defensives, both publisher RELX and pharma company AstraZeneca benefited too over the course of February, contributing nicely to performance. On the flip side, disappointing results from Chinese e-commerce behemoth Alibaba, in particular on top-line growth, hurt performance during the month. However, with the Lunar New Year now behind us and post-Covid spending returning in China, we still think Alibaba will benefit greatly. Another detractor in February proved to be Alphabet, which continues to trade in a limbo as long as digital advertising spend remains lackluster.
Expectation of fund manager
Michiel Plakman CFA
Chris Berkouwer
As it stands, some of the recent equity rally may hold as long as growth stays resilient. But that's exactly where the crux lies: we have too many conflicting macro data points to confidently points us in either direction. What we do know is that equities in general, and the US market in particular, are trading at probably too rich multiples. With inflation proving stickier than many hoped and expected, most equities are starting to price in a rather quick reversal to more normalized levels, something we see as unlikely to happen in the near term. For a further market re-rating we still have a few tall hills to climb. As mentioned in our previous commentaries, we think China remains the wild card of hope with recent upticks in its PMIs, meaning the 'factory engine of the world' is slowly coming back to life. Whether this comes with a roar remains to be seen, but it can certainly have a positive trickle-over effect for other economies as well. Our cautious positioning in the higher quality areas of the market seems to be back in favor again. Hence it is an approach we clearly want to hang onto.