Key points
- Circular Economy is a need-to-have in order to transition toward sustainable production and consumption practices, and to reach global net zero targets
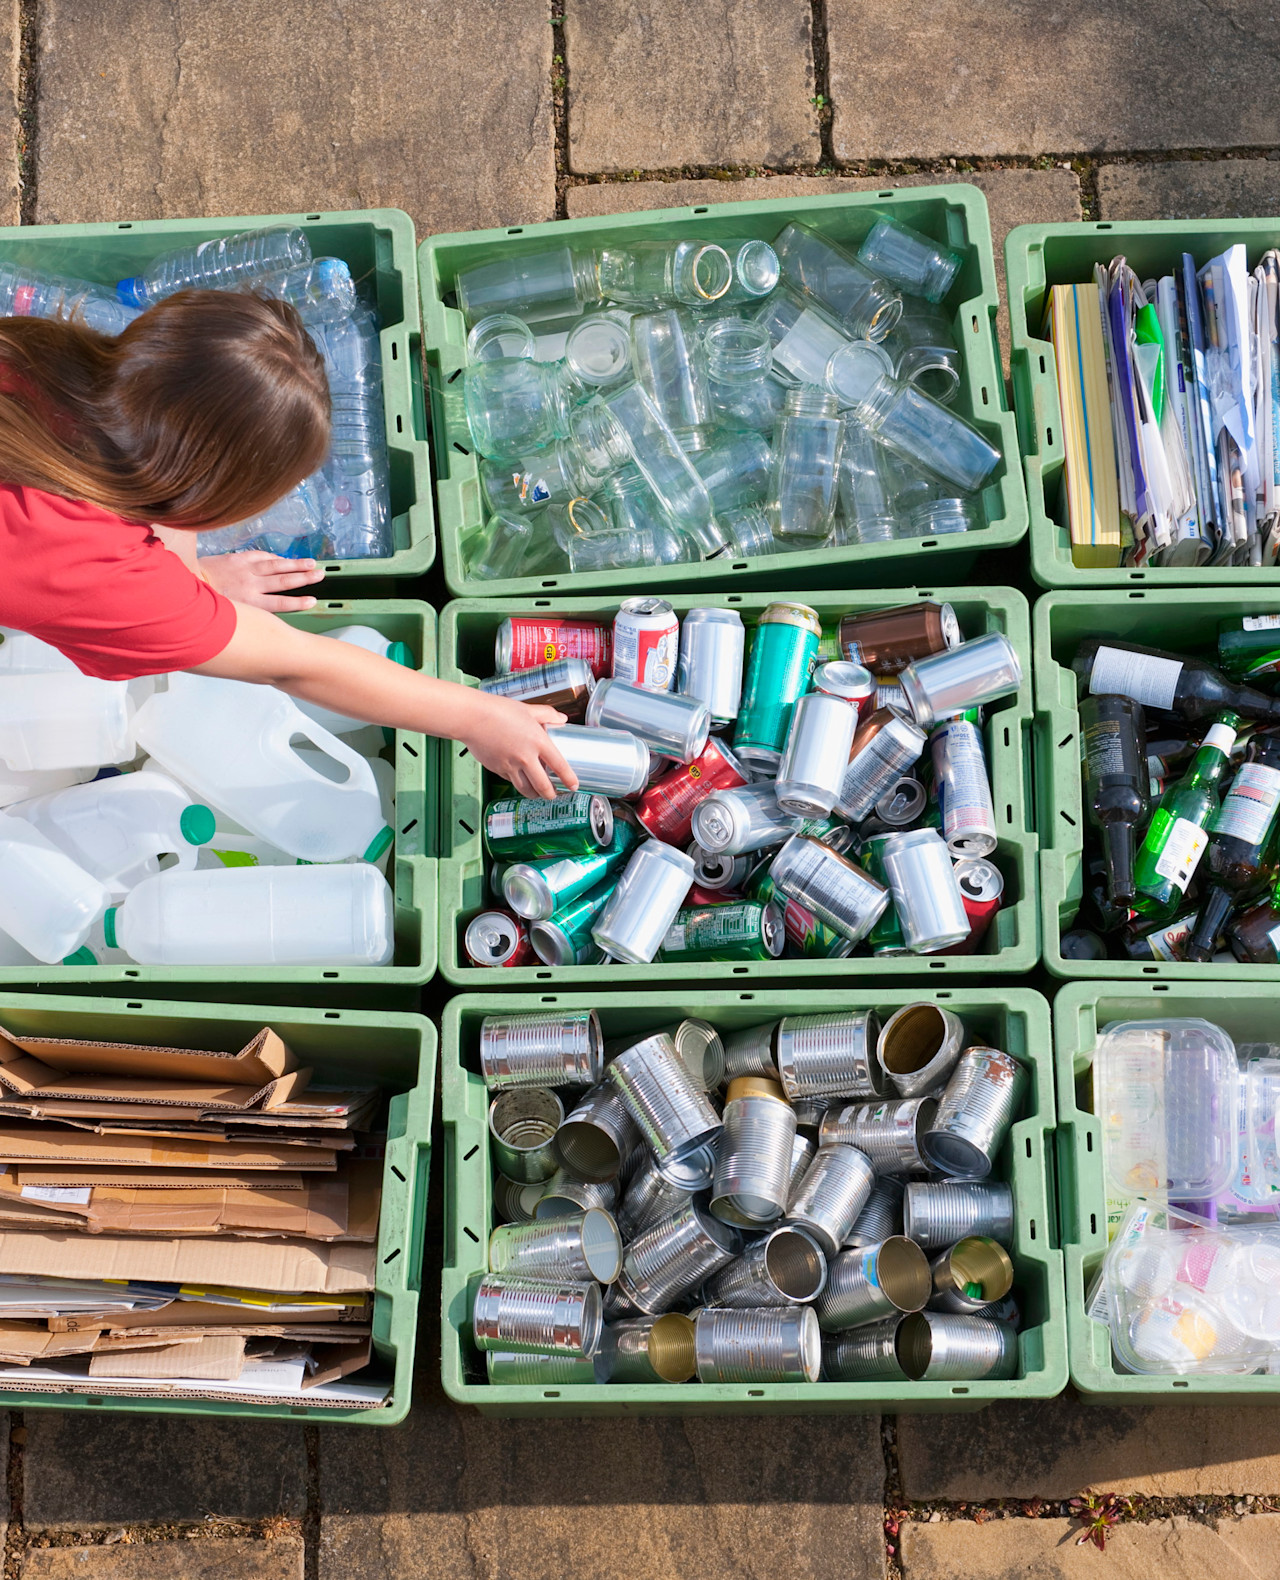
- More than “just” recycling, Circular Economy designs waste and pollution out, and keeps products and materials in use for longer
- Regulation, company commitments and changing consumer preferences provide strong tailwinds for winners across various industries, business models and geographies
About this fund
Robeco Circular Economy is an actively managed fund that invests globally in companies aligned with circular economy principles. The selection of these stocks is based on fundamental analysis. The fund has sustainable investment as its objective, within the meaning of Article 9 of the Regulation (EU) 2019/2088 of 27 November 2019 on Sustainability-related disclosures in the financial sector. The strategy integrates sustainability criteria as part of the stock selection process and through a theme-specific sustainability assessment. The portfolio is built on the basis of an eligible investment universe that includes companies whose business models contribute to the thematic investment objectives. The assessment regarding relevant SDGs uses an internally developed framework, more information on which can be obtained at www.robeco.com/si.
Key facts
| Total size of fund | EUR 856,320,803 |
| Size of share class | EUR 139,924,309 |
| Inception date share class | 23-01-2020 |
| 1-year performance | 39.72% |
| Dividend paying | No |
Fund manager
 Natalie Falkman