Key points
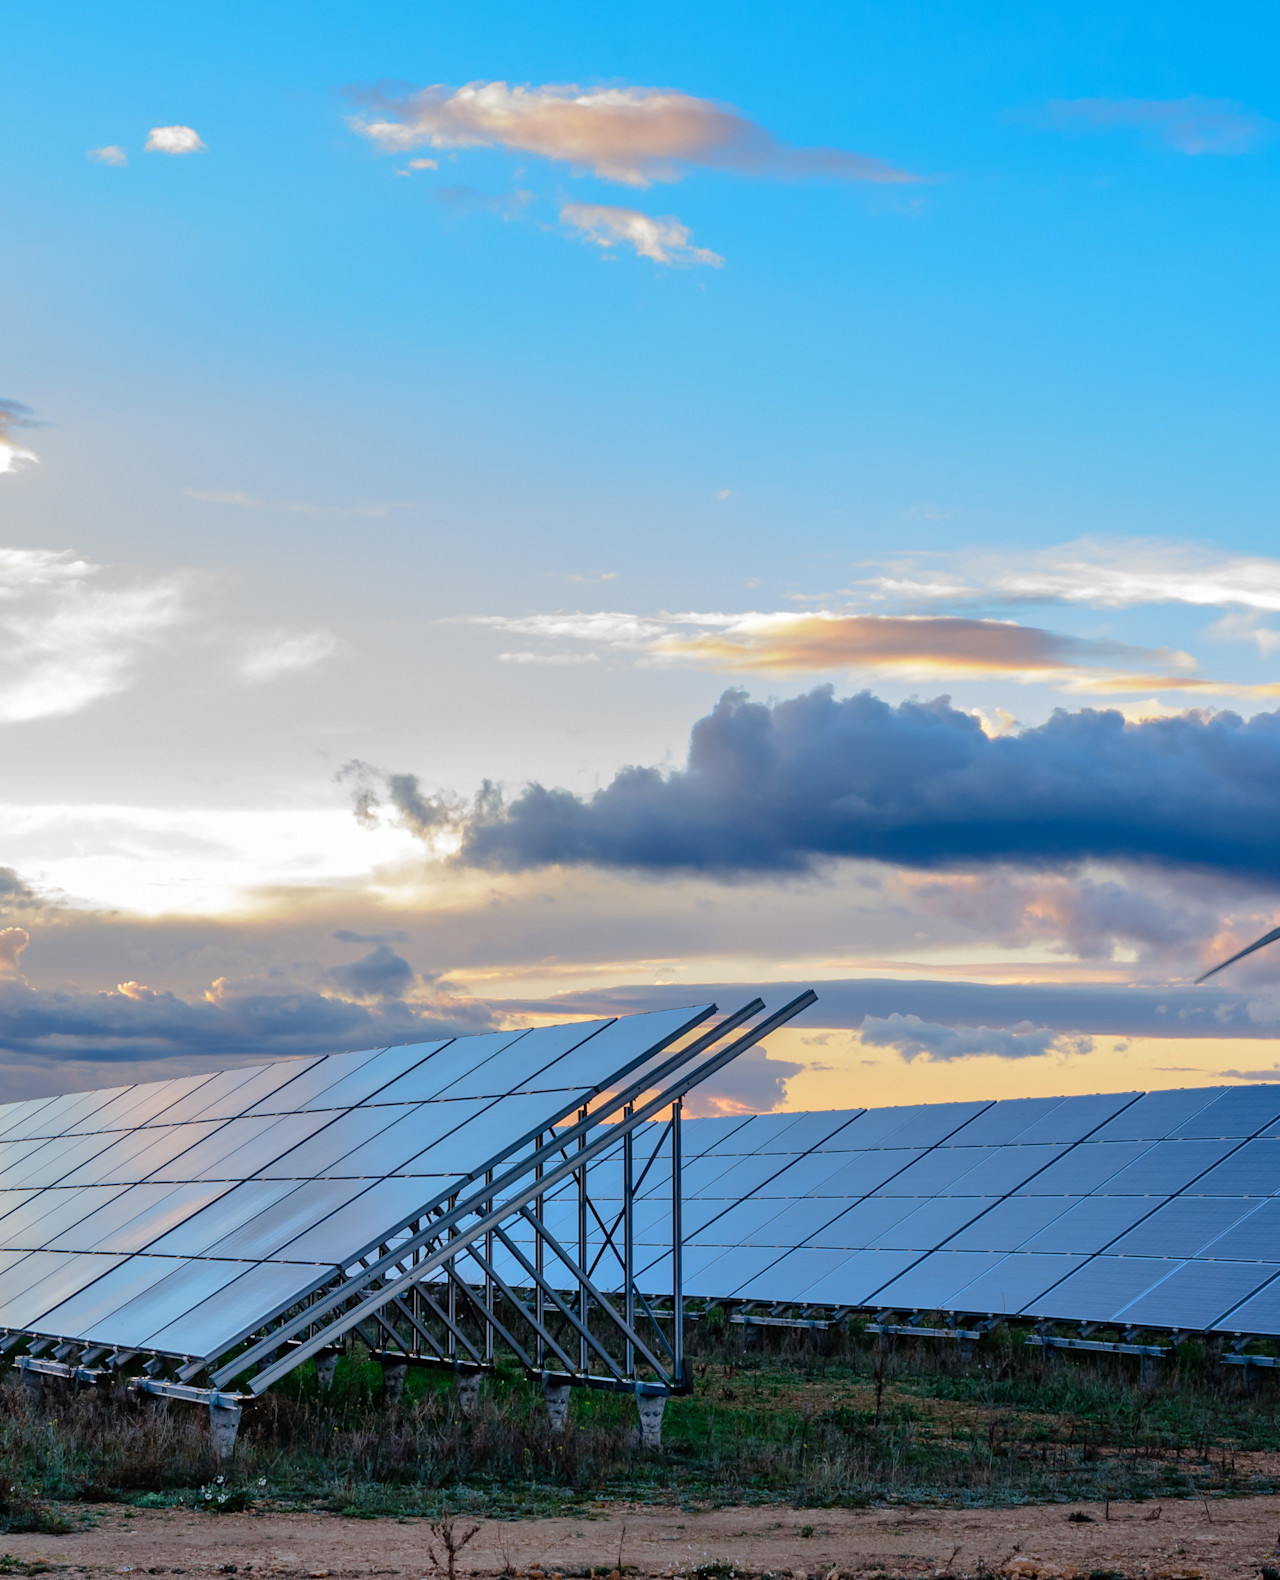
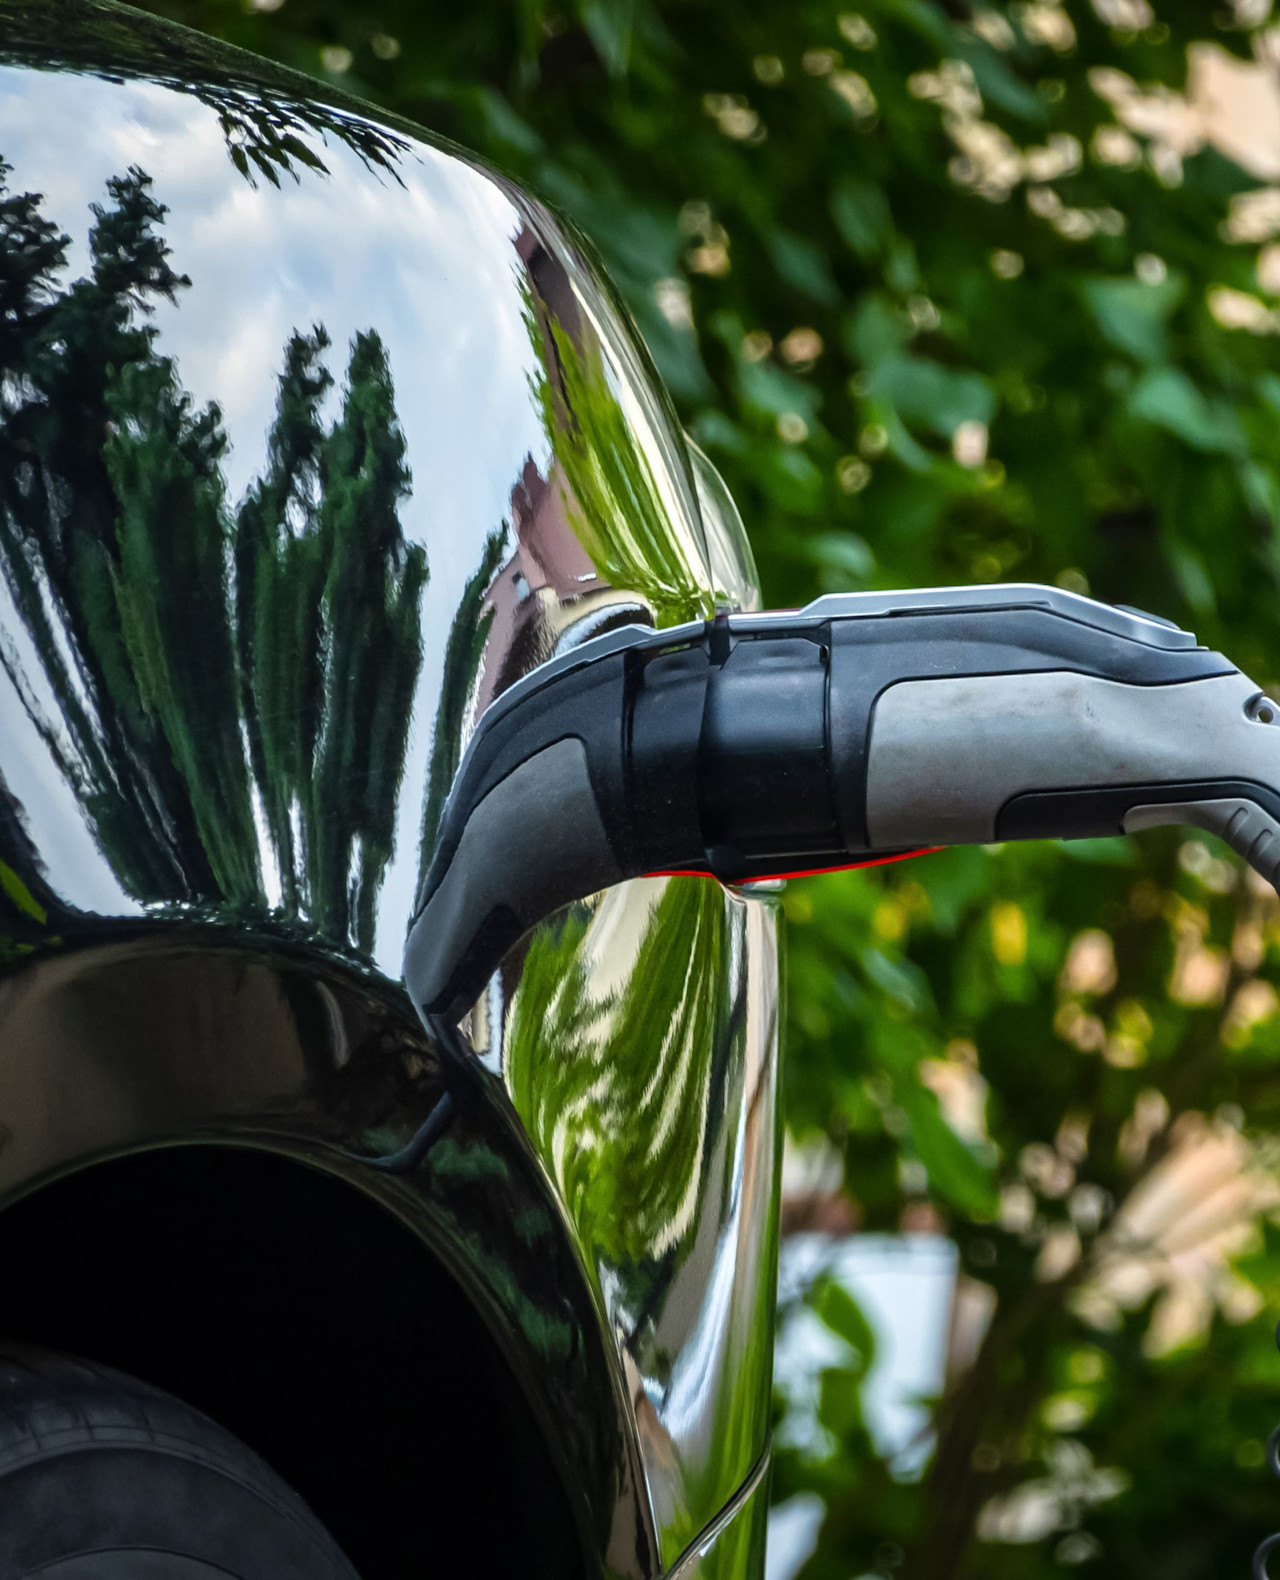
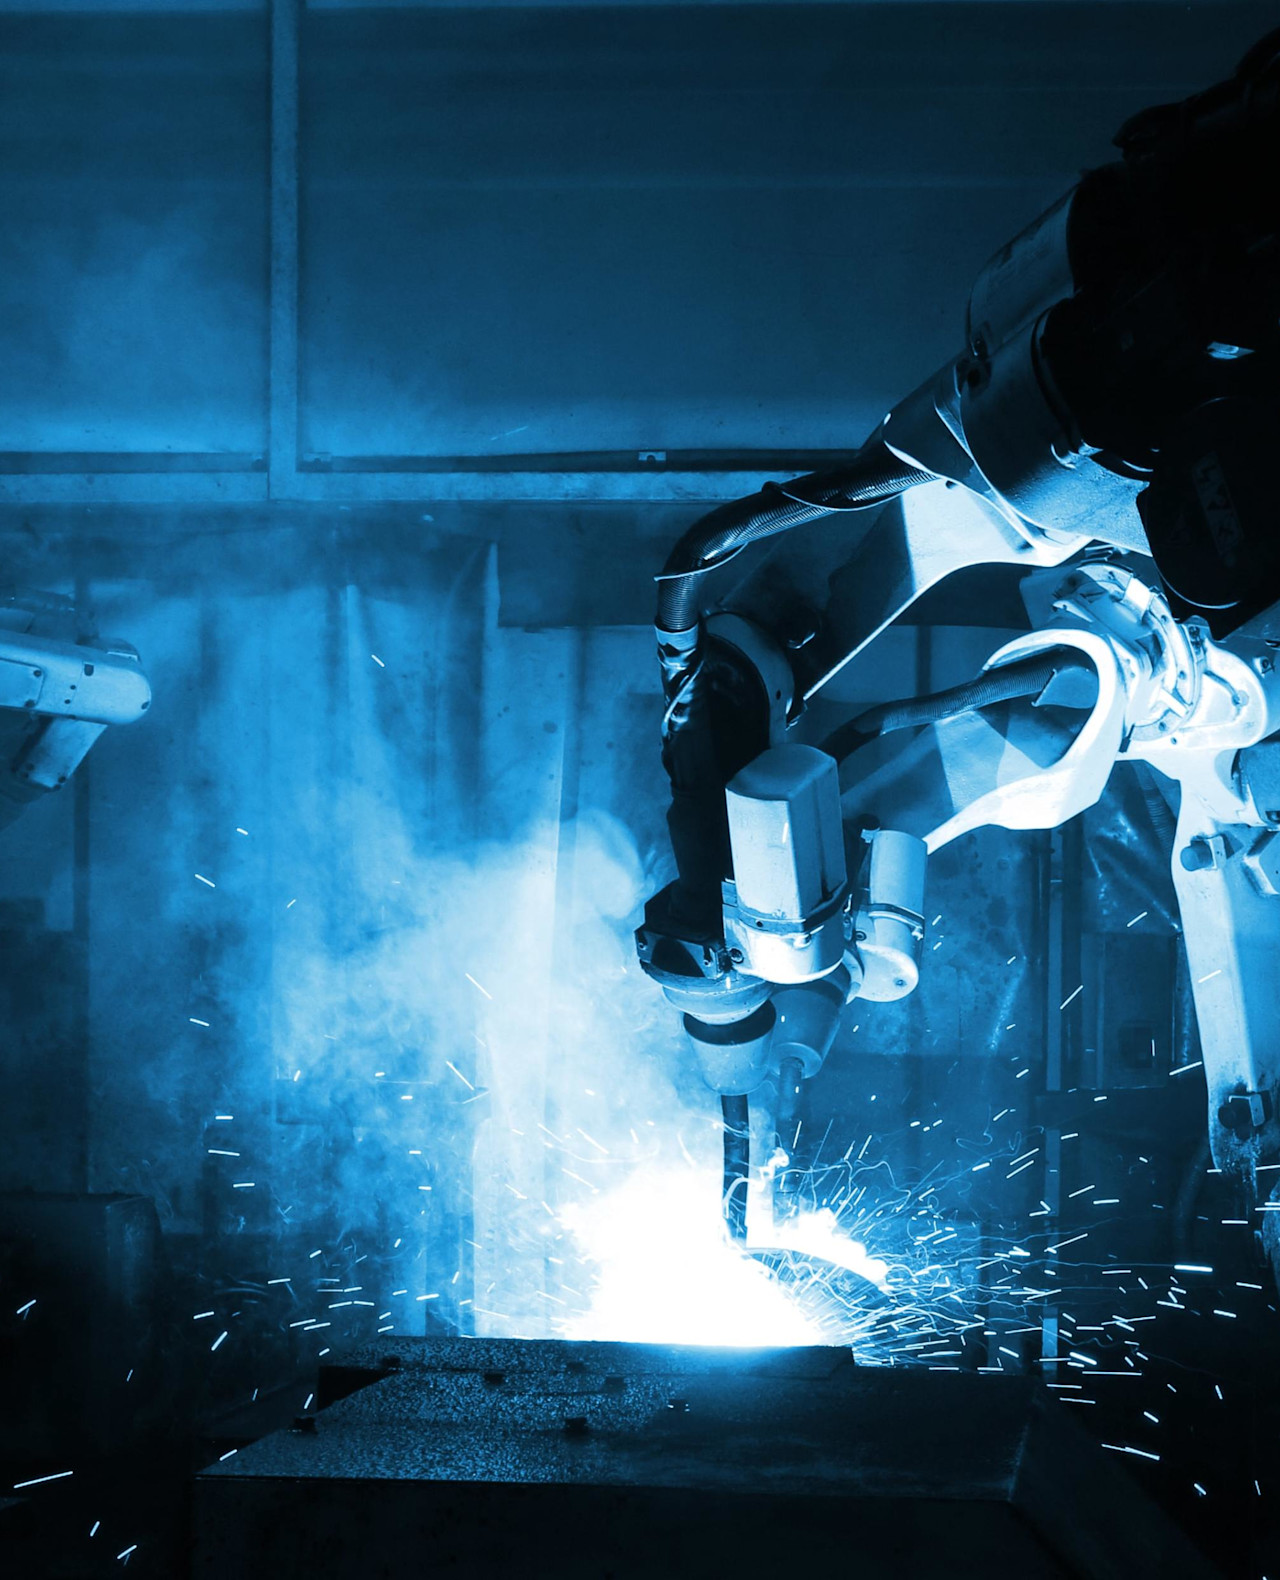
- Focus on advanced materials and smart manufacturing that help optimize the use of natural resources within scalable, clean and efficient solutions
- Investing in structural winners along the entire materials value chain including efficient and innovative materials, improving manufacturing efficiency solutions and end-of-life valorization of materials
- Strong tailwinds from decarbonization and net zero targets, government incentives for reshoring of manufacturing and sourcing, and the shift to more circular practices and sustainability
About this fund
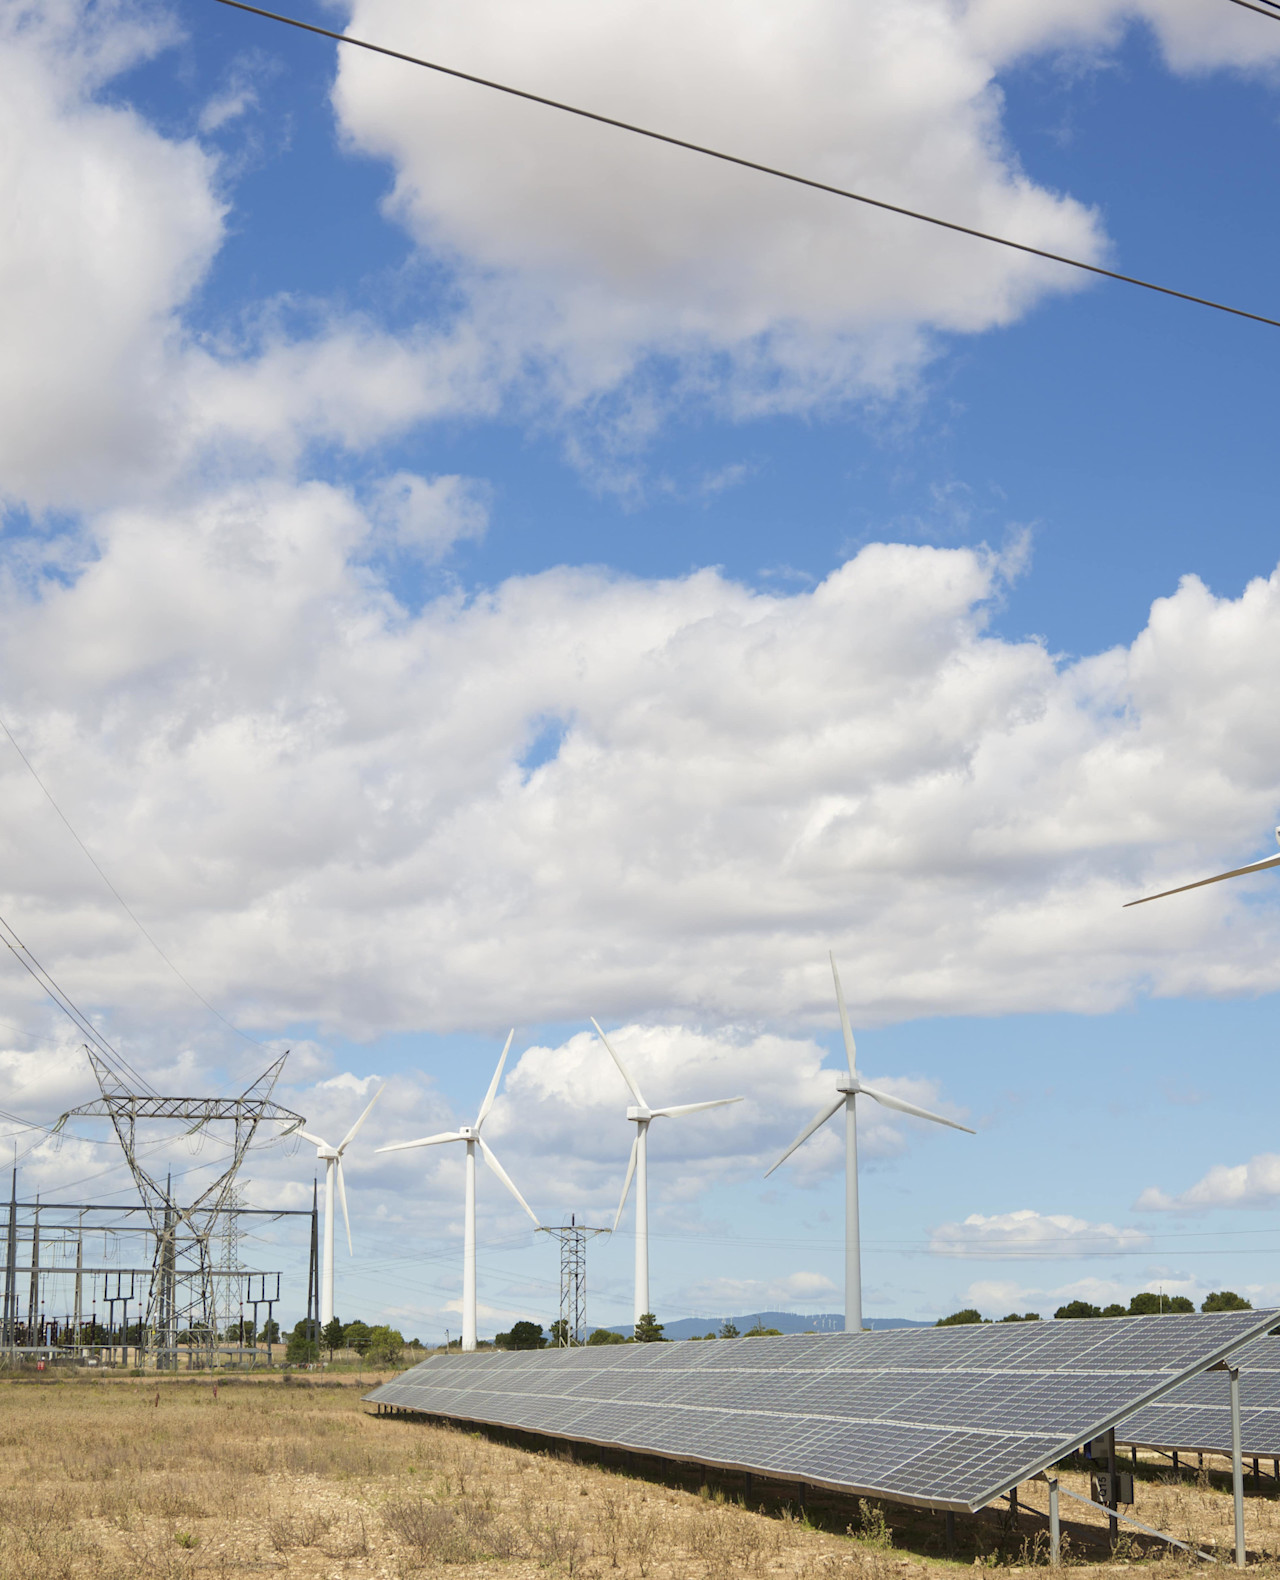
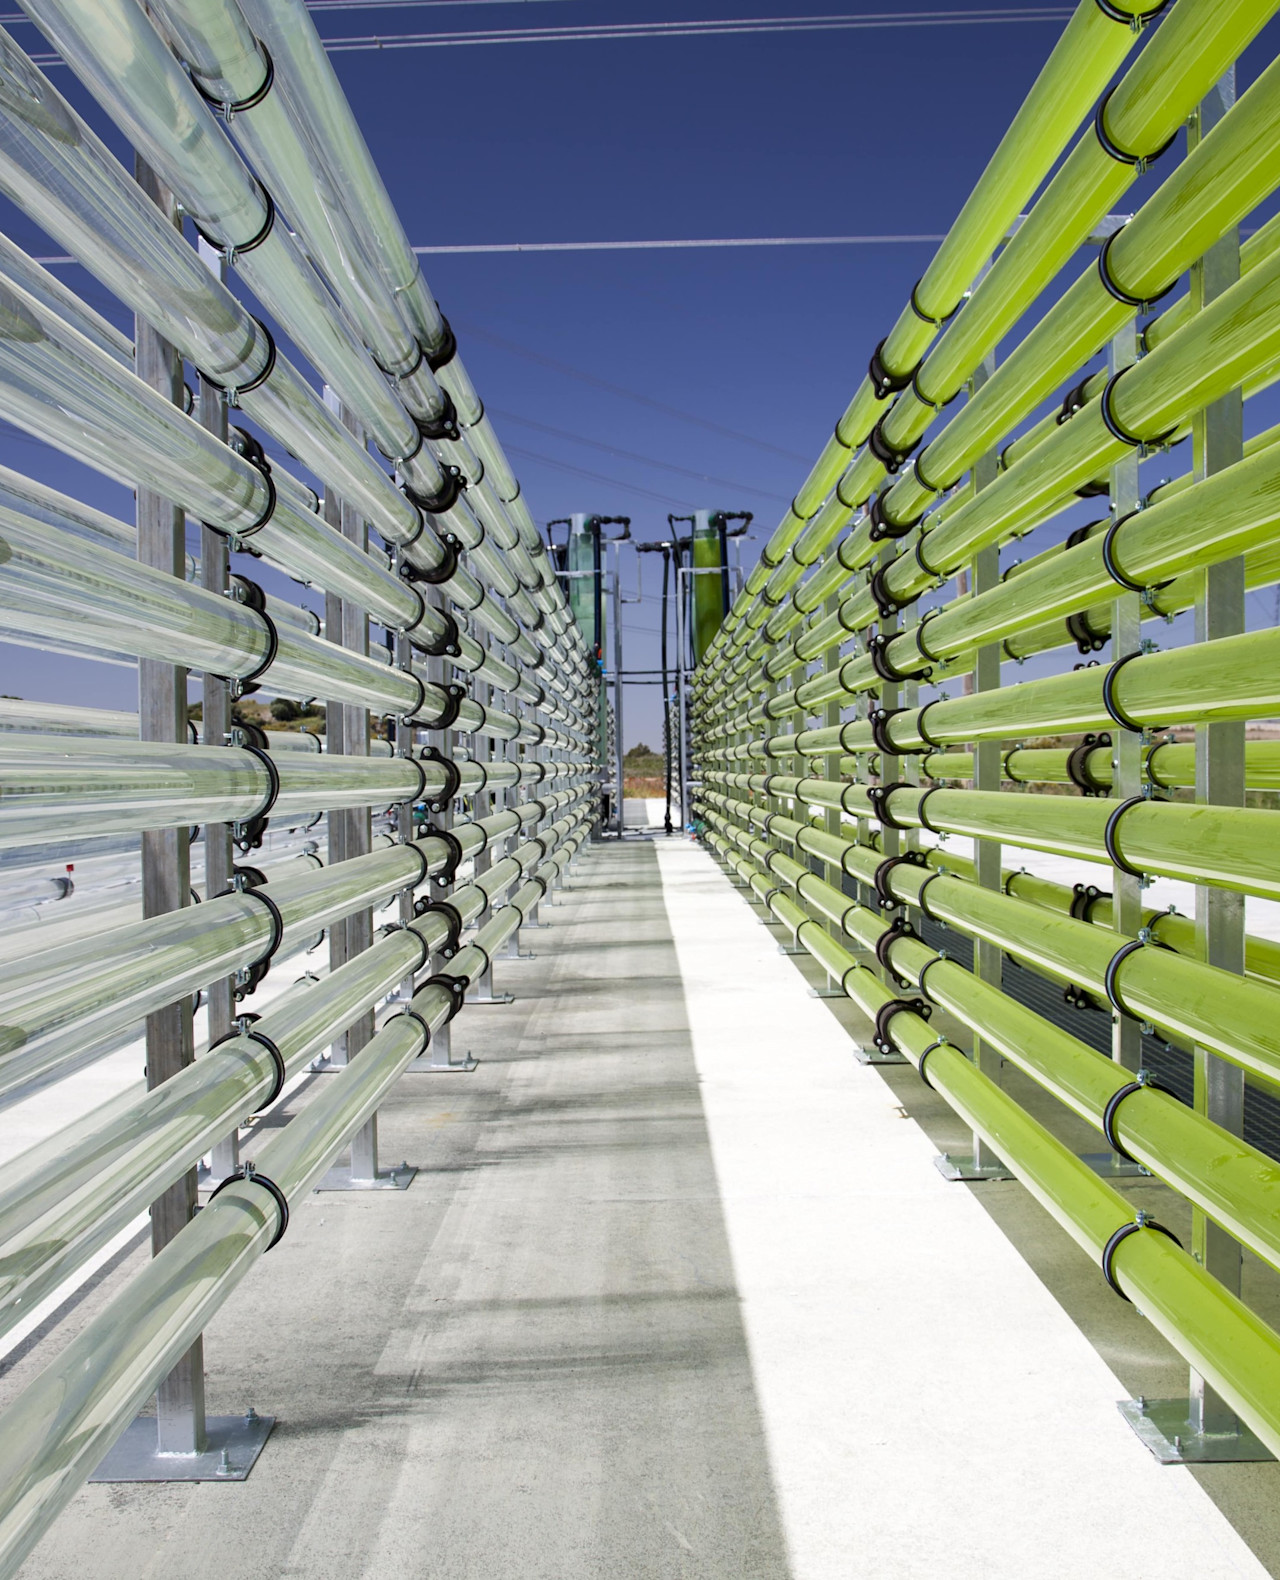
Robeco Smart Materials is an actively managed fund that invests into solutions to the resource scarcity challenge such as innovative materials and process technologies. The selection of these stocks is based on fundamental analysis. The fund has sustainable investment as its objective, within the meaning of Article 9 of the Regulation (EU) 2019/2088 of 27 November 2019 on Sustainability-related disclosures in the financial sector. The strategy integrates sustainability criteria as part of the stock selection process and through a theme-specific sustainability assessment. The portfolio is built on the basis of an eligible investment universe that includes companies whose business models contribute to the thematic investment objectives. The assessment regarding relevant SDGs uses an internally developed framework, more information on which can be obtained at www.robeco.com/si.
Key facts
| Total size of fund | USD 960,591,204 |
| Size of share class | USD 13,955,977 |
| Inception date share class | 29-10-2020 |
| 1-year performance | 101.18% |
| Dividend paying | No |
Fund manager
 Pieter Busscher CFA
 Mutlu Gundogan CFA