Portfolio Manager

• Insight
New metrics offer fresh life and capital to biodiversity investing
Investors have been hesitant to embrace the biodiversity space, but investment momentum and flows should shift with the release of the Taskforce on Nature-related Financial Disclosure game-changing framework.
Authors


Sector Lead
Summary
- Critics argue biodiversity is too complex to effectively measure
- TNFD framework sharpens sector focus and data metrics
- Investors can now better differentiate biodiversity leaders
The destruction of the natural world is accelerating at an alarming rate. The statistics are staggering and while the urgency is well understood, the biodiversity cause has faced challenging headwinds that have hampered momentum and flight. Critics argue that biodiversity is too broad and complex to be effectively measured.
Moreover, until now, companies have been uncertain about what to report. Such ambiguity reduces biodiversity to a vague concept, vulnerable to murky science, inconsistent data and unfounded claims.
Compounding the issue, many view biodiversity loss as an environmental issue and not an economic one. That’s ironic given transitioning to a nature-positive economy is valued at USD 10 trillion in business activity through 2030. 1
But the headwinds are abating with ground-breaking guidance from the TNFD. Officially launched in late 2023, the TNFD’s new reporting recommendations are a collaboration between science and industry experts and mark the first concerted effort to bring order to a landscape of inconsistent metrics and fragmented disclosure.
As a globally recognized framework, the TNFD provides a critical and credible link between the commercial activities of business and what scientists have determined to be the main drivers of biodiversity loss. More specifically, it provides companies with sector-specific KPIs to collect and disclose. In order to prioritize attention on areas of the economy with the greatest material exposure to nature, the TNFD focuses attention on ‘priority sectors’ – those with higher nature-related dependencies, risks and impacts.
Standardized KPIs in high-impact sectors should facilitate comparability and direct regulatory attention and investment flows to companies and industries with capacity to generate the greatest change and deliver the greatest benefit.
Figure 1 – Five major drivers of biodiversity loss
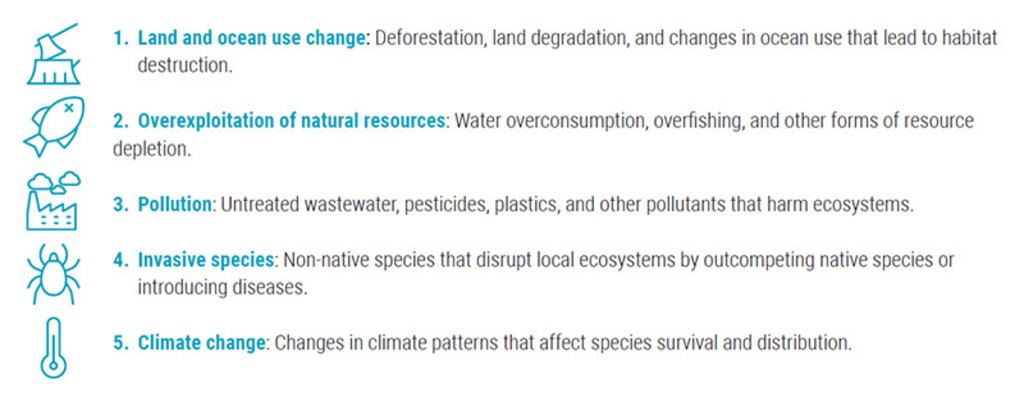
Source: IPBES, Robeco 2025.
From reporting to investing
The TNFD framework is a reporting tool that enables but does not provide investment analysis. Robeco’s Biodiversity Traffic Light, on the other hand, is a proprietary framework designed by our SI analysts to assess sector specific biodiversity performance to integrate into investment portfolios.
The framework combines a comprehensive range of indicators – from company disclosures to our in-house SDG scores and industry-specific data sets – that are linked to the drivers of nature loss and aligned with the TNFD’s recommendations. 2
As with stocks, both current performance and future strategy are used to gauge biodiversity performance. Future performance evaluates companies’ commitments to reducing their impacts with material, quantified, and time-bound targets. Company performance is reported on a gradient moving from ‘aligned’ and ‘aligning’, to ‘partially aligned’ and ‘misaligned’. This type of scaling reflects the forward-looking and continuous evolution in the transition to a nature-positive economy.
Figure 2 – Robeco’s Traffic Light scoring
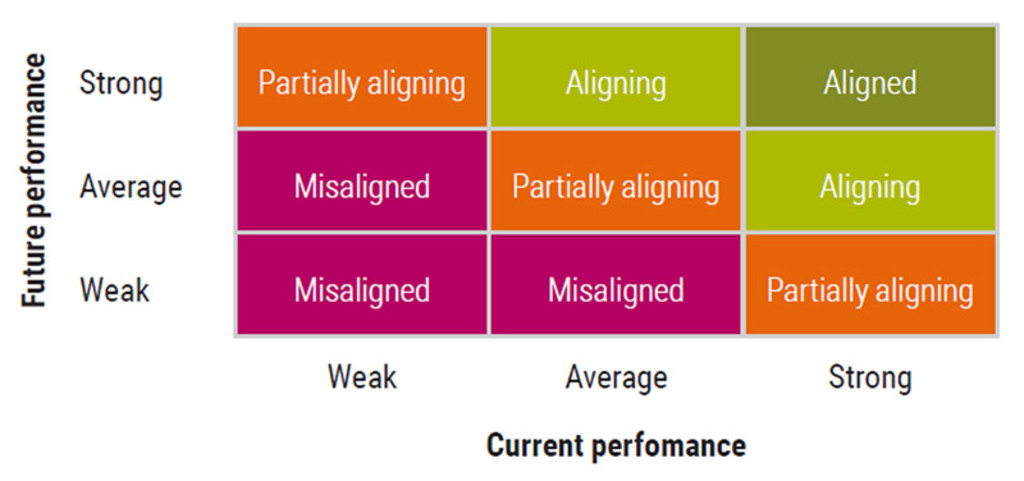
To become a transition leader, a company must have both a current performance and future plans that are average to strong. If a company’s current and future performance is weak, it is assessed as misaligned. Partially aligned companies exhibit both strengths and weaknesses in current and future performance.
Source: Robeco, 2025.
A sharpened investment focus
Robeco’s Biodiversity Equities strategy seeks to capture returns from companies with significant exposure to nature’s services and which are investing to protect and enhance them. The strategy’s investment universe is built around companies within the TNFD’s priority sectors and uses Robeco’s Biodiversity Traffic Light to identify the solution providers and transition leaders.
Targeted solutions
Biodiversity solution providers are companies whose products or activities positively contribute to the protection and restoration of nature and toward reducing the drivers of loss.
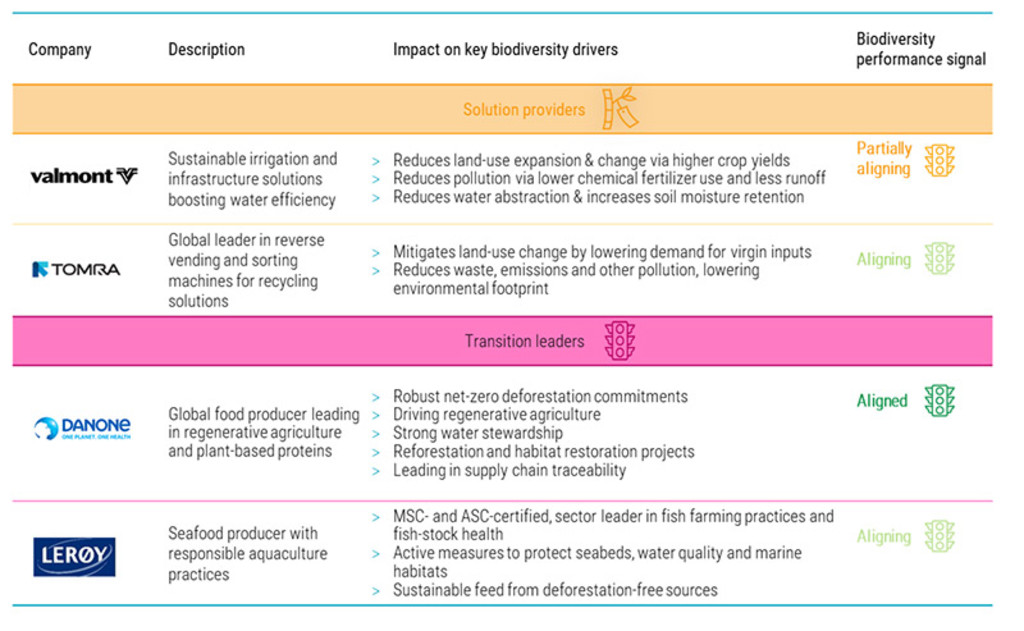
A strong example is Valmont Industries which makes precision irrigation systems that optimize soil moisture and nutrient levels. Compared to traditional flood irrigation, Valmont’s systems can reduce water consumption by up to 40%, minimizing run-off and nutrient loss.3 Optimized irrigation increases crop yields, reducing the need for agricultural land expansion as well as the need for chemical-based fertilizer and pesticides.
Tomra is another example. Their reverse vending machines offer convenient container collection for retail and industrial customers. Meanwhile, their sorting technologies enhance recycled material discovery and recovery across industrial waste streams. The company recycles 49 billion plastic bottles annually in over 60 countries, helping reduce the environmental impact of the 430 million metric tons of plastic produced annually.4,5 Tomra also conserves biodiversity upstream by reducing the extraction of virgin materials.
Figure 3 – Investing for impact
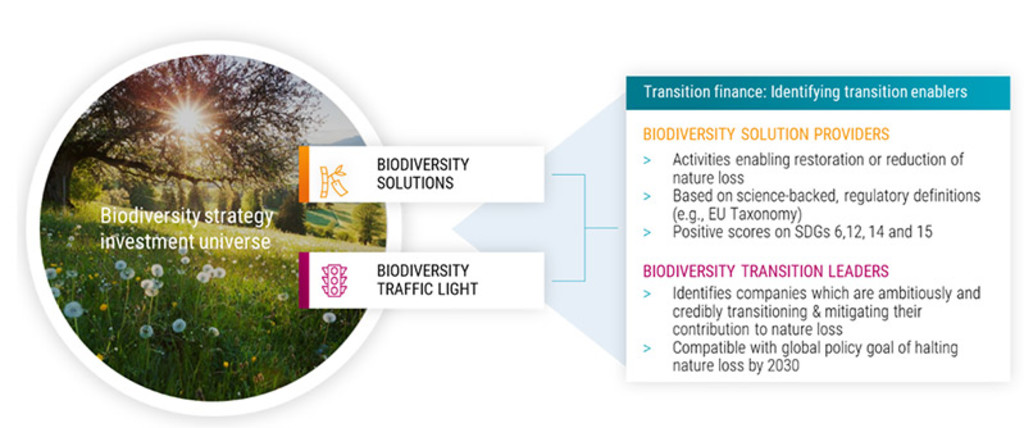
Robeco’s Biodiversity Equities strategy invests in companies creating solutions to mitigate and restore biodiversity loss as well as transition leaders, companies in high-impact industries making meaningful mitigation and restoration efforts.
Source: Robeco, 2025.
Transition leaders
Transition leaders are companies that tend to be resource-intensive and operate in high-impact sectors. While they are exposed to biodiversity risks, they are also actively working to mitigate their impact. Notable examples include Danone and Lerøy Seafood Group, both of which demonstrate alignment or clear progress toward alignment with Robeco’s Biodiversity Traffic Light.
Danone was among the first major food companies to commit to regenerative agriculture – pushing its supplier farms to focus on areas such as water and soil quality, reducing erosion, and practicing crop-rotation. Its also expanding into plant-based product lines with low-footprint proteins as an alternative to meat-based varieties with higher eco-footprints. Danone is also committed to zero deforestation by 2030 and uses third-party certification and satellite monitoring to verify and track land-use changes across its own operations and suppliers.
Lerøy Seafood Group ranks among the top performers in global fish health indices and is MSC- and ASC-certified. It scores highly on independent assessments of seabed and seawater quality at both its marine and land-based farms.6 The company’s feed ingredients are fully traceable to non-deforested and sustainably managed lands. Lerøy continues to invest heavily into more sustainable and circular feed inputs such as microalgae, kelp and mussels to further reduce its ecological footprint. It also has agreed to a three-year engagement with Robeco’s active ownership team with measureable milestones over the duration.
Figure 4 – Illustrative investment cases
Source: Robeco, 2025
Conclusion
BloombergNEF highlights a nearly USD 1 trillion annual gap in financing through 2030.7 Tools like the TNFD and Biodiversity Traffic Light should help accelerate momentum and capital in the space by giving companies, regulators and investors the tools to efficiently evalulate the risks, opportunities and impacts linked to natural resource use.
In addition to capital mobilization, the Biodiversity strategy aims to generate positive portfolio returns. We believe addressing biodiversity risks now leaves our holdings better positioned to navigate future risks such as resource constraints and stringent regulation. Strategic foresight combined with disciplined stock selection and risk monitoring offers clients the opportunity to grow their financial capital in tandem with natural capital – delivering performance that is both resilient and regenerative.
Footnotes
1 World Economic Forum, ‘New Nature Economy Report II: The Future of Nature and Business.’ July 2020.
2 Examples of KPIs include biophysical quantities such as water consumption, non-greenhouse gas air pollution, and hazardous waste generation as well as proxies for nature impacts, such as revenues from the sales of ruminant meat (for land use change) and sourcing of renewable or recycled materials (for resource use).
3 Valmont Industries company website
4 Tomra company website
5 UNEP, ‘Turning off the tap: How the world can end plastic pollution and create a circular economy.’ May 2023.
6 Marine Stewardship Council (MSC) and the Aquaculture Stewardship Council (ASC)
7 BloombergNEF, Factbook 2024. ‘The gap between actual biodiversity financing flows and future needs is USD 942 billion.
Important note:
The companies referenced are for illustrative purposes only in order to demonstrate the investment strategy on the date stated. The companies are not necessarily held by the strategy nor is future inclusion guaranteed. This is not a buy, sell or hold recommendation, nor should any inference be made on the future development of the company.
Keep up with the latest sustainable insights
Join our newsletter to explore the trends shaping SI.
Important information
This information is for informational purposes only and should not be construed as an offer to sell or an invitation to buy any securities or products, nor as investment advice or recommendation. The contents of this document have not been reviewed by the Monetary Authority of Singapore (“MAS”). Robeco Singapore Private Limited holds a capital markets services license for fund management issued by the MAS and is subject to certain clientele restrictions under such license. An investment will involve a high degree of risk, and you should consider carefully whether an investment is suitable for you.