Chief Researcher
Discover the value of quant
Subscribe for cutting-edge quant strategies and insights.






Our research shows that equity risk premiums tend to be higher when risk-free returns are low, and vice versa. This dispels the hypothesis that higher risk-free returns imply higher total average stock returns.



Expected stock returns can be broken down into the risk-free return plus the equity risk premium. The risk-free component is typically assumed to be the return on short-term Treasury bills or longer-term Treasury bonds, depending on the investor’s investment horizon. Meanwhile, the equity risk premium can be interpreted as the reward that investors can expect to earn for bearing the risk of holding stocks. All else equal, a higher risk-free return should therefore imply higher total expected stock returns.
This notion has been contested in several research papers1 over the years. But the analysis has either been based on a relatively short sample period, or does not include the last two decades which had exceptionally low interest rates. In our research paper,2 we revisit the empirical relationship between stock returns and risk-free returns by looking at data from 1866 to 2021 for US markets, and from 1870 to 2021 for international markets.
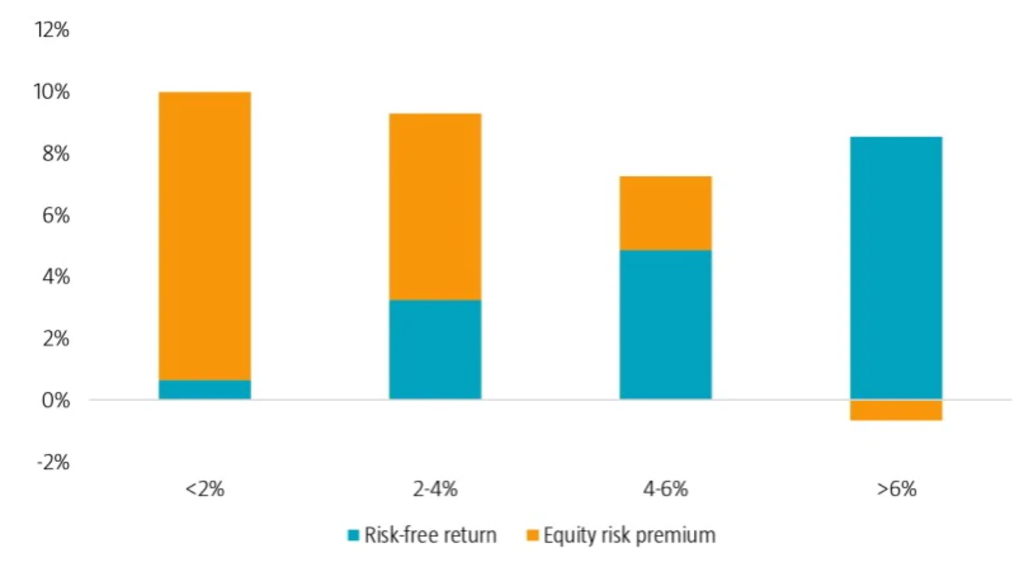
In our analysis, we compared the total stock returns for the US market during different interest rate environments. If equities offer a fairly stable risk premium, then we would expect to observe a similar-sized risk premium for all risk-free return levels and increasing total returns with higher risk-free return levels. However, our results paint a different picture as the total returns were similar for all levels of risk-free returns as shown in Figure 1. This also reflected an inverse relationship between the equity risk premium and the risk-free return.
Source: Robeco Quantitative Research
To further examine the relationship, we regressed the monthly stock returns minus the risk-free returns on the prevailing risk-free return and earnings yield. First, we saw that the estimated coefficient for the risk-free return turned out to be strongly negative. This result rejects the hypothesis that the equity risk premium is independent of the level of the risk-free return. In fact, it is more supportive for the alternative hypothesis that total expected equity returns are similar during times of low and high risk-free returns. Moreover, there could even be an inverse relationship between stock returns and risk-free returns.
Second, we noted that the estimated coefficient for the earnings yield was significantly positive. Taken together, these regression results imply that the equity risk premium increases with the earnings yield but decreases with the risk-free return. This is in line with a similar finding in another study3 which concludes that the difference between stock yields and bond yields has predictive power for future stock returns.
Subscribe for cutting-edge quant strategies and insights.
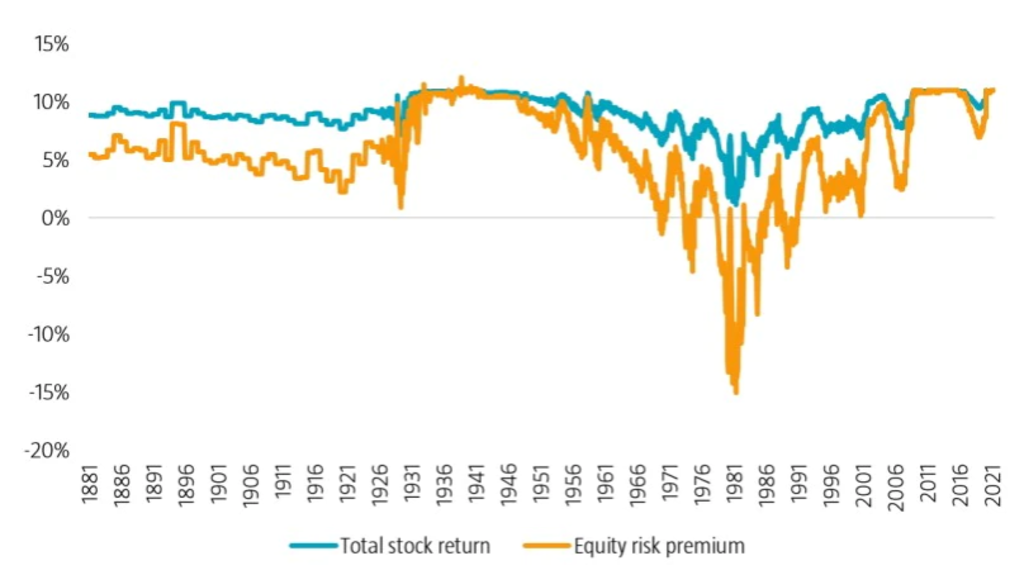
We also looked into the implied equity risk premium estimates based on our regression analysis and calculated the corresponding total stock returns by adding back the prevailing risk-free returns. First, we scrutinized the results based on a regression analysis that had risk-free returns as the sole variable. As depicted in Figure 2, we found that the predicted total stock returns were more stable than the forecast equity risk premiums.
Source: Robeco Quantitative Research
Over our sample period, the predicted total stock returns typically oscillated between a range of 8% and 11%. The most notable deviation from this was during the late 1970s and early 1980s when interest rates were very high, which translated into lower expected returns. The expected total return was still positive, but after accounting for the high risk-free returns, the forecast equity risk premiums were extremely negative during this phase.
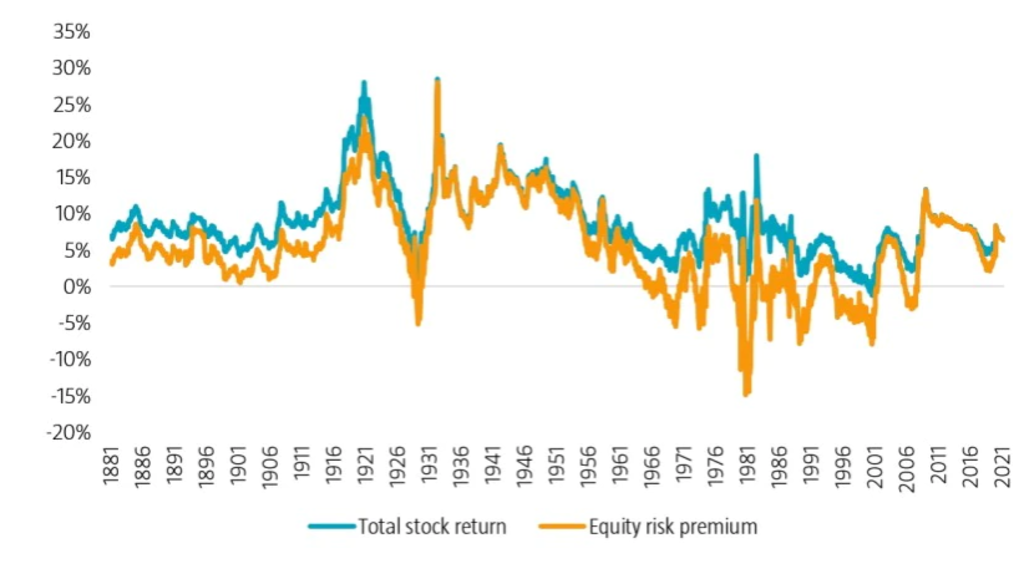
Second, we carried out a similar analysis with results based on a regression analysis that had risk-free returns and earnings yield as the variables. In this instance, the predicted total stock returns exhibited much stronger time variation, as Figure 3 illustrates.
Source: Robeco Quantitative Research
That said, the predicted stock returns remained more stable than the forecast equity risk premiums. Moreover, the former were not lower during periods with low risk-free returns, such as the 1940s and 2010s, than during intervals with high risk-free returns, such as the 1970s and 1980s. As a result, the predicted equity risk premiums were generally higher in phases with low risk-free returns.
To negate a data snooping bias, we also investigated the outcomes when using data from international markets. We found very similar results, as the estimated coefficient for the risk-free return was negative for all 16 countries included in the sample. These findings correspond with expected total stock returns being constant and the equity risk premium being inversely related to the risk-free return.
Again, this implies high equity risk premiums when risk-free returns are low and low equity risk premiums when risk-free returns are high, all else equal.
All in all, our findings lead us to strongly reject the hypothesis that a higher risk-free return implies higher total expected stock returns. Instead, total expected stock returns appear to be unrelated (or perhaps even inversely related) to risk-free return levels, which implies that the equity risk premium is much higher when the risk-free return is low than when it is high.
While our observations do not imply a profitable tactical asset allocation rule that could be applied in real time, we believe our findings challenge the conventional wisdom about expected stock returns. Therefore, our findings should be considered in strategic asset allocation decisions, particularly when the risk-free return is very high or very low compared to its historical average.
1Fama, E.F., and Schwert, G.W., November 1977, “Asset returns and inflation”, Journal of Financial Economics; Fama, E.F., and French, K.R., November 1989, “Business conditions and expected returns on stocks and bonds”, Journal of Financial Economics; Chen, N., June 1991, “Financial investment opportunities and the macroeconomy”, Journal of Finance; and Ang, A., and Bekaert, G., May 2007, “Stock return predictability: is it there?” The Review of Financial Studies.
2Blitz, D., February 2022, “Expected stock returns when interest rates are low”, working paper.
3Maio, P., July 2013, “The ‘Fed model’ and the predictability of stock returns”, Review of Finance.
This information is for informational purposes only and should not be construed as an offer to sell or an invitation to buy any securities or products, nor as investment advice or recommendation. The contents of this document have not been reviewed by the Monetary Authority of Singapore (“MAS”). Robeco Singapore Private Limited holds a capital markets services license for fund management issued by the MAS and is subject to certain clientele restrictions under such license. An investment will involve a high degree of risk, and you should consider carefully whether an investment is suitable for you.