Portfolio Manager


• Insight
Earnings growth is surging, but inflation risks are building
Global earnings are surging but a hawkish Fed pivot, and stretched AI valuations argue for a cautious rotation toward cyclicals, value, and international diversification rather than chasing momentum.
Authors



Summary
- Earnings surge could stoke inflation
- Rate expectations have flipped to a more hawkish bias
- Rotation towards companies with resilient cashflows could protect against multiple compression
Let’s start with the good news, because there’s a lot of it. The earnings backdrop right now is, frankly, quite extraordinary. Forward earnings for the S&P 500 are running near +29%1, and this isn’t just a mega-cap mirage; mid-caps are around +18% and small-caps near +24%. The last time we saw numbers like these we were clawing out of the financial crisis or the pandemic. The difference is we don’t have a recession this time. That’s what makes the cycle so unusual: a rising-tide-lifts-all-boats earnings surge with no crater to climb out of, powered by lagged rate cuts, a hefty fiscal package (Trump’s ‘One Big Beautiful Bill’ legislation in the US), and the AI capex firehose. Add it up and you get multiple points of GDP growth in combined stimulus landing more or less at once. For the next few months, that earnings momentum should keep stocks moving higher. Now the catch...
The thing about earnings this strong
Earnings growth this powerful will almost always travel with a companion you’d rather not invite: inflation. The two move together because they’re both consequences of a hot economy. ISM prices-paid gauges are sitting at levels that have historically front-run a pickup in core inflation (see Figure 1). This pipeline pressure is already showing up in stickier core services, housing disinflation that’s basically tapped out, tariffs, and an oil scare out of the Middle East that could take six to nine months to fully bleed into core prices. The uncomfortable historical nugget: when S&P earnings growth runs north of 20%, the Fed has ended up tightening in roughly seven of the last eight episodes. Which brings us to rates.
Figure 1: Higher earnings = higher prices
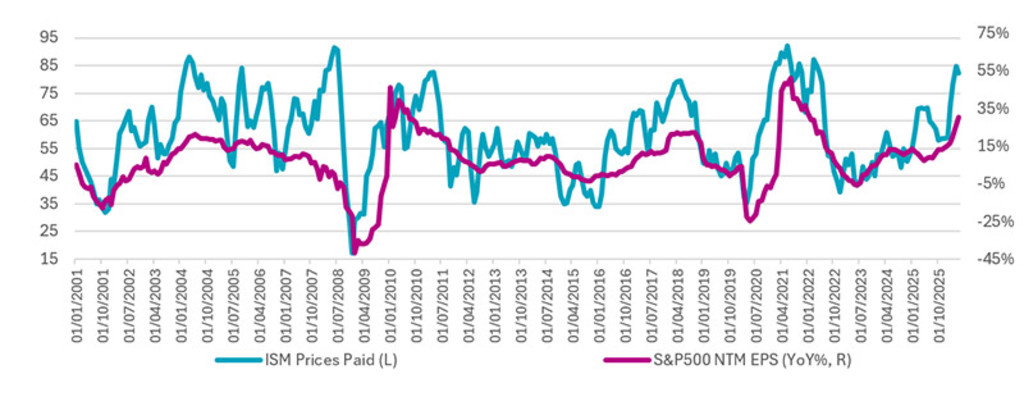
Source: BMO Capital Markets, Bloomberg
Central banks: from tailwind to headwind
This is the regime change almost nobody is positioned for. The global easing cycle is over, and the live question is no longer “how many cuts” but “will they hike?” The labor market the Fed fretted about last year has healed; job growth has picked up and the unemployment rate is flat versus a year ago, when policy was 75 bps tighter. Meanwhile the inflation problem has quietly worsened, and new Fed Chairman Kevin Warsh has leaned hawkish, hammering price stability and sounding skeptical that AI will ride to the rescue with disinflation. Some major banks, including Bank of America, now pencil in three 25 bps hikes before the year-end, which would take the policy rate back toward 4.25-4.50%. Remember, going from cuts priced in to hikes priced in is a genuine shift, and it will land hardest on the longest-duration corners of the market.
If inflation is firming and the Fed is leaning hawkish, cyclicals and value tend to do well Chris Berkouwer


Chris Berkouwer
Portfolio Manager
The AI/momentum problem
Here’s where it gets interesting. The relentless march of momentum names – AI front and center – is starting to rhyme with the run into March 2000. AI is now about the most crowded consensus long on the board. The main difference from the dotcom era is that the fundamentals are real this time: US Tech’s economic profit is around 10x its 2000 level, and Tech ex-US now out-earns all of listed Europe combined. So it isn’t pure hype. Having said that, the hyperscalers are pouring so much into capex that returns on capital are coming under pressure, while the rest of the AI food chain is priced for profits nobody has ever actually delivered. In a higher-for-longer world, Tech is increasingly a geared duration bet. When discount rates were anchored at post-GFC lows, paying up for far-off growth made sense; it looks a lot more stretched now. Layer on the AI-sovereignty wildcard that includes protectionism, export controls, Europe’s dependence on US technology, China building its own stack for the East – and the world’s most crowded trade has more ways to wobble than consensus admits.
So where do you actually look?
The interesting part of an overheating, broadening tape is that the laggards finally get a turn. If inflation is firming and the Fed is leaning hawkish, cyclicals and value tend to do well – they’ve already beaten defensives by double digits over the past year, and high-beta has come roaring back. The opportunity set outside the magnificent few looks genuinely interesting. Europe is also the most de-correlated major region from US Tech, which makes it a natural hedge for anyone nervous about concentration. The region is rich in the cyclicals and quality defensives (Pharma, Utilities) that suit this backdrop, though its old dependence on US technology is a real vulnerability if AI sovereignty becomes a fault line. Japan's reflation-and-reform story still has legs, with the caveat that a normalizing BoJ and a firmer yen are the swing factors. And emerging markets – China's home-grown AI build-out and Asian cyclicals especially – are the highest-beta way to play a softer dollar and a broadening tape.
The shape of the next quarter(s)
The base case from here is still an up-but-bumpy path for global equities, with the rates-geopolitics-AI triangle as the key swing factor. For now, earnings are simply too good and the stimulus is still washing through – before the bill comes due. Given the valuation backdrop, any setbacks on the US-Iran ‘deal’, growing headwinds as core inflation gains momentum, or a more sober tone by central banks, could translate into air pockets. Companies with real moats, low cash-flow volatility, and decent dividends are the kind of ballast that holds up if the multiple-compression story shows up.
Figure 2: June saw non-AI stocks join the rally
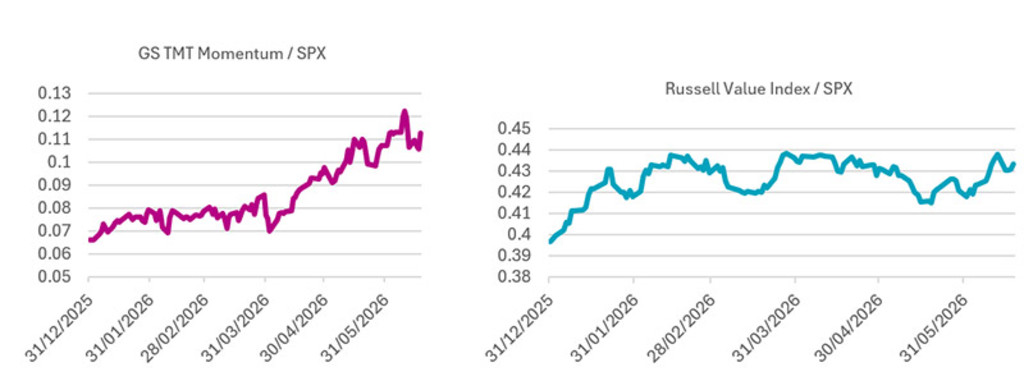
Past performance is not guarantee of future results. The value of your investment may fluctuate.
Source: Bloomberg, CLSA. Data to 18 June 2026. SPX refers to S&P 500 index. GS TMT Momentum refers to Goldman Sachs Technology, Media, and Telecom Momentum index
In portfolio terms, that argues for a tilt toward quality growth and AI-linked names, but with more respect for rate sensitivity and less bravado in the most expensive corners of the market. Cyclicals and value should weather that better than long-duration Tech. None of this is a crash call; it’s a call for broadening, rotation, and a little humility about the most crowded trade in the world. Enjoy the party; just stand near the door.
This article was originally published in our Fundamental Equity Quarterly for Q3.
Footnote
1BMO Capital Markets estimate, June 2026
Get the latest insights
Subscribe to our newsletter for investment updates and expert analysis.
Important information
THIS WEBSITE IS SOLELY INTENDED FOR PROFESSIONAL INVESTORS, WHICH HAS THE MEANING ASCRIBED TO IT IN THE SECURITIES AND FUTURES ORDINANCE (CAP. 571 OF THE LAWS OF HONG KONG) AND ITS SUBSIDIARY LEGISLATION. Investment involves risks. Past performance is not indicative of future performance. The information contained in this website is provided for reference only and does not constitute investment advice or an offer or solicitation to buy or sell in any securities or to adopt any investment strategy. Investors should not base their investment decisions solely on the information provided on this website and are advised to seek independent advice (including advice on tax implications) before making any investment decisions. Investors should ensure they fully understand the risks associated with the investment products and should also consider their own investment objectives and risk tolerance level. The investment decision is yours. You should not invest unless the intermediary who sells you the investment products has advised you that it is suitable for you and has explained how it is consistent with your investment objectives. Please refer to the relevant offering documents or other legal documents for further details including the risk factors. This website is published by Robeco Hong Kong Limited which is regulated by the Hong Kong Securities and Futures Commission (“SFC”) (CE No. APU851). This website has not been reviewed by the SFC. No assurance can be given that the investment objective of any investment products will be achieved. No representation or promise as to the performance of any investment products or the return on an investment is made. The value of investments may fluctuate. Past performance, projections, or forecasts included in this website should not be regarded as guarantees or indications of future performance, and no express or implied warranty is provided. The contents of this website are based on sources believed to be reliable, but due to the nature of information delivery technology and the necessity of using multiple data sources, including third party content, their accuracy is not guaranteed. The opinions expressed are as of the date shown above and may change as market conditions evolve, and are subject to change without notice. These opinions may differ from those of other Robeco investment professionals. Robeco accepts no liability for any direct, indirect, or consequential loss arising from the use of this material or any comments, opinions, or estimates contained herein. Robeco has no duty to update this website or any website content. Materials on this website may not be reproduced, distributed, or published without prior written permission from Robeco. Unless otherwise specified, Source: Robeco.