Global Head of Client Portfolio Management


• Insight
Double delight: Seizing the dual discount in emerging markets
Is now the time to seize investment opportunities in emerging markets? We believe the answer is a resounding 'Yes.'
Authors






Researcher
Summary
- Emerging markets equities offer a substantial discount over developed markets
- EM value strategies are currently trading at historically low valuations
- Robeco Quant EM strategies are designed to efficiently capture both market and factor premiums
Based on historical valuation metrics, both absolute and relative, we believe the time is ripe to seize the dual discount in emerging markets. Our recent research outlines this 'double discount' opportunity presented by emerging markets factor-based equities and highlights how Robeco Quant Equities strategies are specially designed to capture both market and factor premiums efficiently.
This change doesn't spell doom for emerging markets; rather, it highlights an underexplored 'double discount' investment opportunity
For over a decade, developed markets have enjoyed the boon of falling interest rates, catapulting growth stocks to sky-high valuations. However, this landscape has shifted as central banks raise interest rates to combat inflation. This change doesn't spell doom for emerging markets; rather, it highlights an underexplored 'double discount' investment opportunity.
Emerging markets have suffered from an image problem, often viewed as underperforming compared to their developed counterparts, as discussed in a recent article. But this perception masks a more nuanced reality. Our data, illustrated in Figure 1, shows that emerging markets outperformed developed ones from 1999 to 2011 but have lagged since.
The data also reveals that emerging markets tend to outperform when they become relatively more expensive than developed markets and underperform when they become cheaper. Currently, the value spread between emerging and developed markets is at levels last seen 20 years ago—right when emerging markets began to outperform their developed counterparts.
Figure 1 – Relative performance and valuation of emerging markets versus developed markets (January 1996 to July 2023)
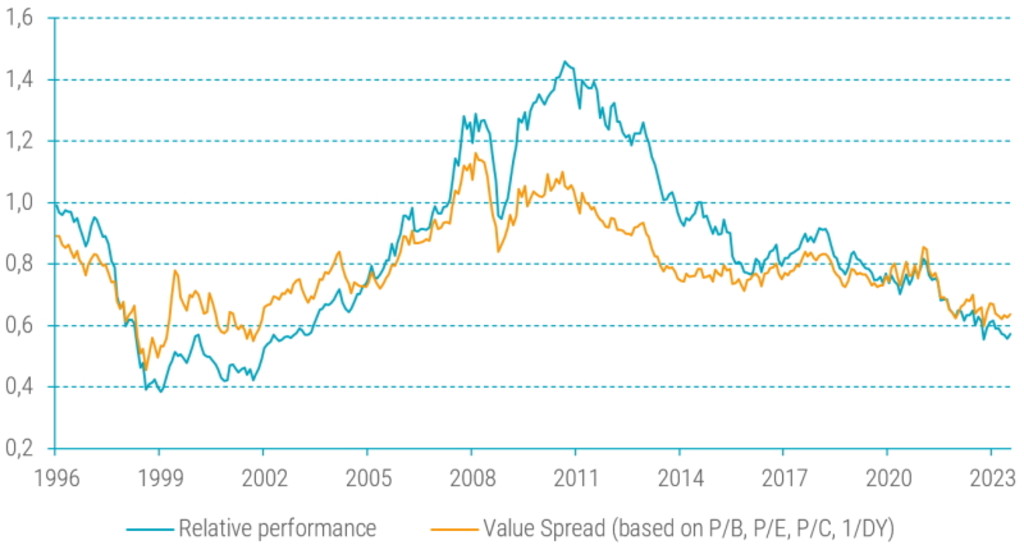
Source: Robeco, MSCI. The figure shows the relative performance and valuation spread of the MSCI Emerging Market Index vs. the MSCI World Index. Performance is measured via the total return index, and the valuation spread is based on four bottom-up-calculated multiples (price-to-book, price-to-earnings, price-to-cash EPS, and price-to-dividend). For each multiple, the valuation ratio of the MSCI Emerging Markets Index is divided by the same valuation ratio for the MSCI World Index. The sample period is January 1996 to July 2023.
In essence, the decline of emerging markets over the past decade has been more a function of changes in relative valuation rather than deteriorating fundamentals. In fact, annual fluctuations in these valuations account for over 75% of the variation in performance between emerging and developed markets, as seen in Figure 2.
Figure 2 – Relative performance and valuation of emerging versus developed markets
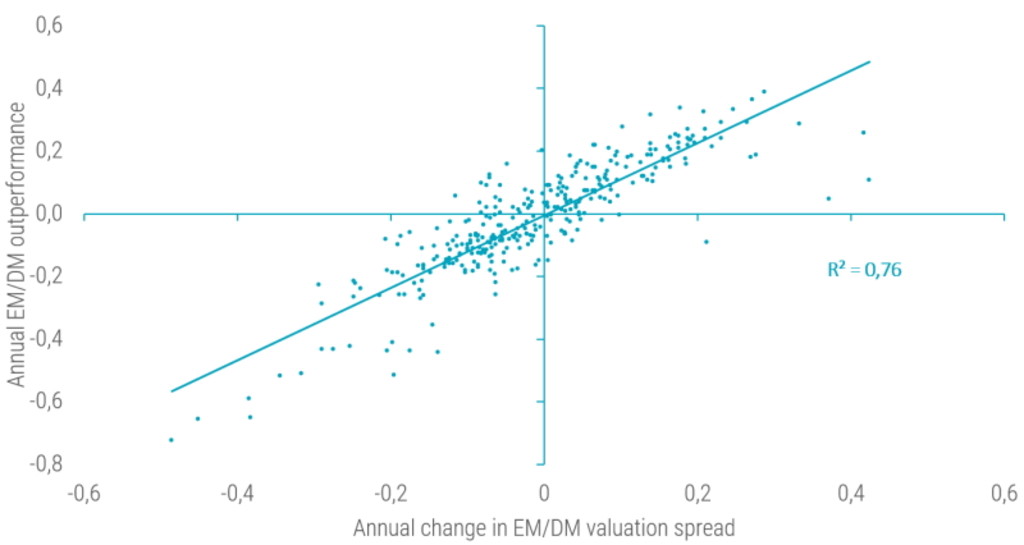
Source: Robeco, MSCI. The figure shows the relationship between the relative performance and changes in valuation spreads for the MSCI Emerging Market Index vs. the MSCI World Index. Relative performance is the continuously compounded 12-month relative performance, while the change in the valuation spread is the log of the ending value spread minus the log of the starting valuation spread. Performance is measured via the total return index and the valuation spread is based on four bottom-up-calculated multiples (price-to-book, price-to-earnings, price-to-cash EPS, and price-to-dividend). For each multiple, the valuation ratio of the MSCI Emerging Markets Index is divided by the same valuation ratio for the MSCI World Index. The sample period is January 1996 to July 2023.
How Value factors in
Within this broader landscape, value stocks in emerging markets offer a particular appeal. The valuation spread between value and growth stocks remains wider than usual, providing a fertile ground for investors.1
Figure 3 – Value trading at a historic discount in developed markets and even more so in emerging markets
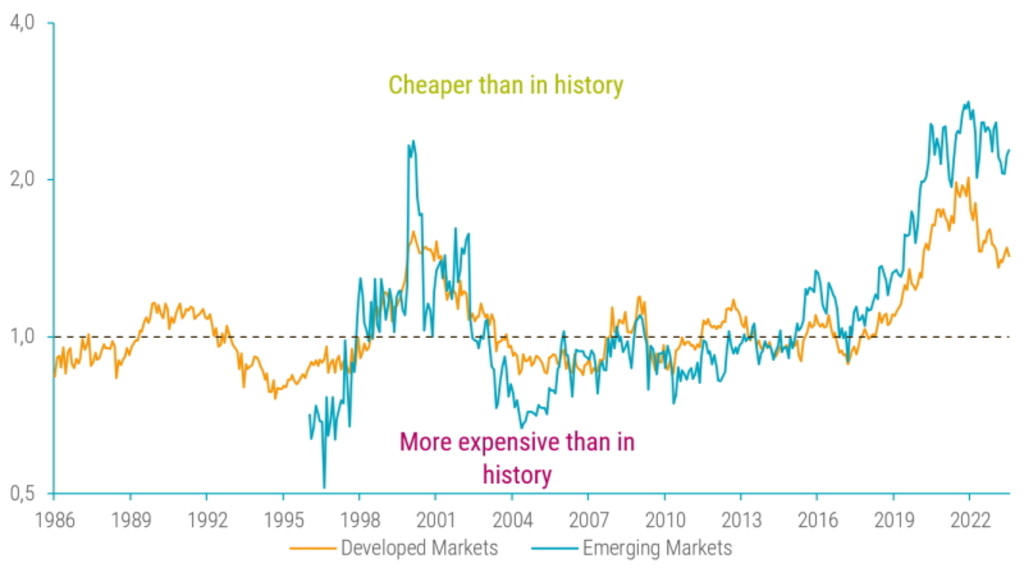
Source: Robeco, Refinitiv. The figure shows the valuation spread between the top and bottom quintile portfolios of a value strategy for developed and emerging markets. Details regarding the definition of the value strategy and the valuation spread are provided in footnote 1. The investment universe consists of constituents of the MSCI World and MSCI Emerging Markets indices. Before 2001, we use the FTSE World Developed Index for developed markets (going back to December 1985), and for emerging markets, the largest 800 constituents of the S&P Emerging BMI at the semi-annual index rebalance (going back to December 1995). The sample period is December 1985 and December 1995 to July 2023 for developed and emerging markets, respectively.
Structural and realized alpha
Why is it that despite a recent recovery in value, these stocks are still trading at a considerable discount compared to their 2018 levels? While changes in the value spread account for a significant part of the returns, they don't explain the entire picture. Read our full article on how the realized value return can be decomposed in a structural and revaluation alpha and how this decomposition can be used to form medium-term return expectations for the value factor in emerging markets. Moreover, we explain how Robeco's strategies have successfully capitalized on value and other factors such as quality, momentum, analyst revisions and novel next-gen factors.
Double discount
The current 'double discount' in emerging markets offers a golden investment opportunity, particularly as central banks in developed nations near the end of their monetary tightening cycles. Our multifaceted EM strategies not only aim for high risk-adjusted returns but also focus on sustainable investment dimensions, making these well-poised to leverage this unique market moment.
Footnotes
1 We define value and the value spread as in Blitz, D. C., and Hanauer, M. X., January 2021, “Resurrecting the value premium”, Journal of Portfolio Management. More specifically, the value strategy is based on a composite of book-to-market (R&D adjusted), EBITDA/EV, CF/P, and NPY. Value stocks are sorted into quintile portfolios based on the valuation composite and in a region and sector respectively country neutral manner for developed and emerging markets. Quintile portfolios are equal-weighted and reformed monthly. The value spread is expressed as the ratio of a basket of valuation multiples of the top and bottom quintile value portfolios. We control for value spread differences that are normally observed between both portfolios, such that a value spread above one indicates cheapness. Since cheap stocks by definition have higher fundamental value to price ratios than their expensive peers, it is particularly important for the value factor to scale the value spread by its historical normal level.
Important information
THIS WEBSITE IS SOLELY INTENDED FOR PROFESSIONAL INVESTORS, WHICH HAS THE MEANING ASCRIBED TO IT IN THE SECURITIES AND FUTURES ORDINANCE (CAP. 571 OF THE LAWS OF HONG KONG) AND ITS SUBSIDIARY LEGISLATION. Investment involves risks. Past performance is not indicative of future performance. The information contained in this website is provided for reference only and does not constitute investment advice or an offer or solicitation to buy or sell in any securities or to adopt any investment strategy. Investors should not base their investment decisions solely on the information provided on this website and are advised to seek independent advice (including advice on tax implications) before making any investment decisions. Investors should ensure they fully understand the risks associated with the investment products and should also consider their own investment objectives and risk tolerance level. The investment decision is yours. You should not invest unless the intermediary who sells you the investment products has advised you that it is suitable for you and has explained how it is consistent with your investment objectives. Please refer to the relevant offering documents or other legal documents for further details including the risk factors. This website is published by Robeco Hong Kong Limited which is regulated by the Hong Kong Securities and Futures Commission (“SFC”) (CE No. APU851). This website has not been reviewed by the SFC. No assurance can be given that the investment objective of any investment products will be achieved. No representation or promise as to the performance of any investment products or the return on an investment is made. The value of investments may fluctuate. Past performance, projections, or forecasts included in this website should not be regarded as guarantees or indications of future performance, and no express or implied warranty is provided. The contents of this website are based on sources believed to be reliable, but due to the nature of information delivery technology and the necessity of using multiple data sources, including third party content, their accuracy is not guaranteed. The opinions expressed are as of the date shown above and may change as market conditions evolve, and are subject to change without notice. These opinions may differ from those of other Robeco investment professionals. Robeco accepts no liability for any direct, indirect, or consequential loss arising from the use of this material or any comments, opinions, or estimates contained herein. Robeco has no duty to update this website or any website content. Materials on this website may not be reproduced, distributed, or published without prior written permission from Robeco. Unless otherwise specified, Source: Robeco.