Climate Specialist


• Insight
The challenges of mapping carbon emissions: Scope 3 - Part one
Many investors are committed to the ambition of achieving net zero carbon by 2050. To do this, it is vital to know the emissions of portfolio holdings across the full supply chain – but this is easier said than done. In the first edition of a three-paper mini-series on scope 3 emissions, we describe what they are, and why they are so much more challenging to work with than scopes 1 and 2.
Authors


Climate Data Scientist
Top keywords
Summary
- Managing scope 3 emissions at portfolio level is challenging
- Lower scope 3 downstream emissions are not always better
- Recommend splitting portfolio emissions into a production phase and use phase
Aggregated carbon emissions are widely used by asset managers to measure and set targets on the footprints of their investment portfolios. In most cases, the portfolio footprint is solely measured by scope 1 and 2 emissions, while scope 3 is generally neglected due to its quality and reliability being regarded as low.1
However, scope 3 contains important information on the pollutive levels of a company and should not be ignored. Regulation also encourages asset managers to incorporate portfolio-level scope 3 emissions. For instance, scope 3 is required for climate benchmark construction in the EU and needs to be reported under the Sustainable Finance Disclosure Regulation (SFDR).
Scope 1 emissions are those that are directly generated by the company, such as an airline emitting exhaust fumes.
Scope 2 emissions are those that are created by the generation of the electricity or heat needed by the company to sell its main products or provide its main services.
Scope 3 emissions are the remaining emissions that occur along the entire value chain. Under the GHG Protocol, they are broken down into 15 categories, ranging from upstream emissions including ‘purchased goods and services’, to downstream emissions including ‘the use of products sold’. In the case of a car, for example, scope 1 emissions are generated by the auto manufacturer, and scope 2 by the energy used to power the factory. Scope 3 emissions are generated by the driver of the car, and are much more difficult to measure, since the car’s use, and how it is driven, cannot
be reliably tracked.
Why is scope 3 so much more challenging?
If it is difficult enough to track on a company and product basis, it is even harder to do across portfolios. The GHG Protocol Standard acknowledges the difficulty in trying to aggregate and compare scope 3 emissions across portfolios and then make comparisons:
The use of this standard is intended to enable comparisons of a company’s GHG emissions over time. It is not designed to support comparisons between companies based on their scope 3 emissions
Indeed, scope 3 is in most cases already considered by fundamental analysts at an individual company level, but when setting portfolio level targets, it becomes very challenging. Nevertheless, the necessity to steer our portfolios on this scope urges us to search for a solution for aggregating and comparing scope 3 without outweighing scope 1 and 2, nor
overstating the portfolio’s footprint.
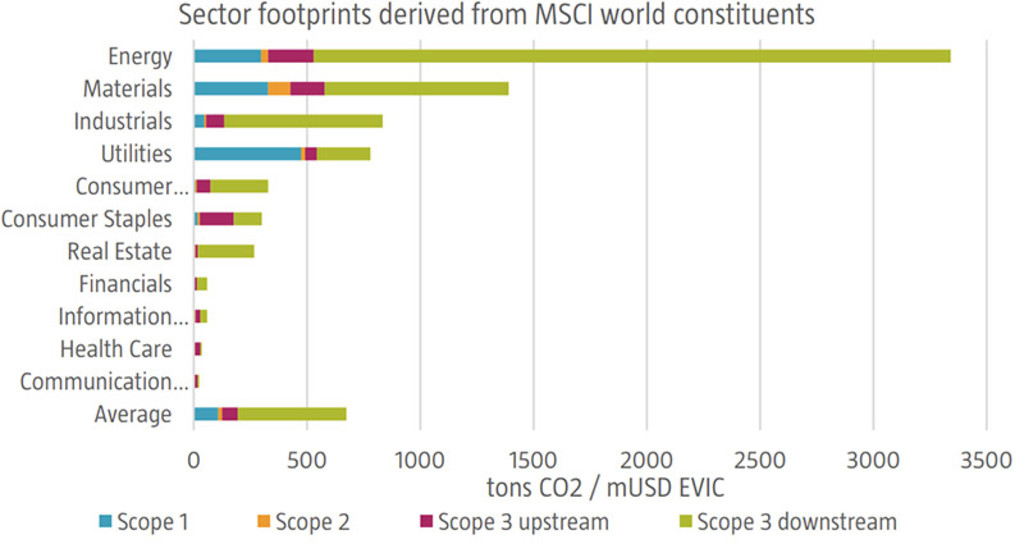
Let’s start with a sector-based visualization of footprints, as seen in figure 1. There are three main observations that stand out from the chart. First, some sectors are much more polluting than others – it should come as no surprise that the energy sector is the worst. Second, scope 3 downstream emissions are dominant in almost all sectors. Lastly, and in contrast to downstream, scope 3 upstream emissions turn out to be of limited size, with a total magnitude ranging between scope 1 and 2.
Figure 1: Sectoral carbon footprints of the MSCI World Index
Now suppose that asset managers include portfolio-level scope 3 in the management and monitoring of their investment portfolios. Scope 1 and 2 emissions would become much less relevant, as in many cases these get overshadowed by the large scope 3 downstream figure. This is an undesired and counterintuitive consequence of including scope 3, as companies have the largest influence on their scope 1 and scope 2 emissions, since these are closely related to their
business activities.
Perverse outcomes
On the other hand, not including scope 3 at all can also lead to perverse outcomes. Take the example of a company that manufactures escalators. The steps of the escalator are made of steel and need to be built under very high temperatures. If the company has onsite production facilities to accomplish this, its scope 1 emissions would be high. However, if they
ordered prefabricated stairs from an all-purpose steel producer instead, the emissions would labelled as upstream scope 3. So, if scope 3 is not considered in constructing portfolios, companies can significantly reduce their emissions footprint by outsourcing their most polluting activities.
It seems that both ignoring scope 3 or fully incorporating it with scope 1 and 2 are not viable options. What we want to investigate now is whether it is possible to break scope 3 down so that the essential input of value chain emissions can be taken into account without dominating the rest of the footprint.
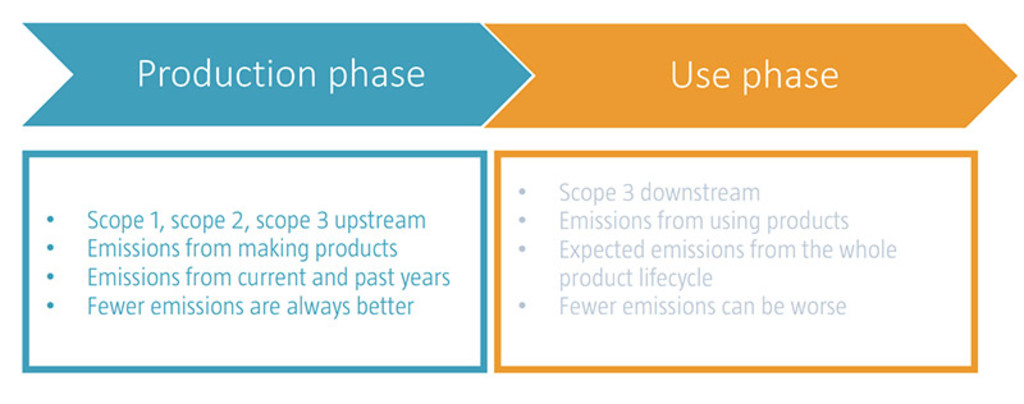
Figure 2 offers a visual representation of a simplified value chain broken down into a production phase and a use phase. The production phase encompasses all emissions from making the product, which generates scope 1, 2 and 3 upstream emissions, whereas the use phase contains all the emissions from further processing and using the product, which is
measured by scope 3 downstream emissions.
Figure 2: Company emissions can be broken down into a production and use phase
Scope 3 downstream emissions are fundamentally different
An important distinction between the emissions in the production and use phases is how these are calculated. In the production phase, a company includes all the emissions that making their products has generated. For the use phase, the company has to estimate the emissions that will take place over the whole lifecycle of the products sold that year. Thus, scope 3 upstream emissions are occurred emissions, while scope 3 downstream emissions are expected emissions.
For many products, the latter is extremely dependent on usage assumptions, and when aggregated over the whole life cycle also in part explains why scope 3 downstream can become so dominant. A good example of this is looking at the emissions of an aircraft producer versus the emissions of an airline. The aircraft producer must disclose in its Scope 3 downstream emissions, the emissions expected from the aircraft over its useful lifetime.
For example, Airbus reports the useful lifetime of one of its aircrafts as 22 years, according to its CDP disclosure. For each aircraft, it therefore reports 22 years of emissions in its scope 3 downstream reporting. On the other hand, an airline that operates these aircraft only needs to report the emissions of those aircrafts in its scope 1 emissions over the reporting year. Therefore, all other things equal, Airbus’s Scope 1+2+3 emissions would be 22 times those of an airline’s scope 1+2+3 emissions.
Lower scope 3 downstream emissions are not always good
This also leads us to another critical observation: larger scope 3 downstream emissions may not always be a bad thing. Take two LED lightbulb manufacturers. Manufacturer A produces lightbulbs which last on average 50 years, so its scope 3 downstream emissions will be reported as the electricity used during the 50-year lifetime of the lightbulb. Manufacturer B,
on the other hand, produces lightbulbs but with an average life of 25 years. As a consequence, Manufacturer B’s emissions are half those of Manufacturer A. Despite having twice the emissions, one would surely say that Manufacturer A has a better environmental impact, as its lightbulbs last twice as long.
This is a very important point because when it comes to carbon emissions, we are always talking about decarbonization, and therefore emission reduction. But in the case of Scope 3 downstream, in their current form, this could lead to an incentive by issuers to make products which have shorter working lives.
Limited guidance available
So far, most of the solutions offered for managing scope 3’s dominance relate to separating it from scope 1 and 2, and there is limited guidance available for incorporating scope 3 into portfolio-level target setting. To ensure a consistent approach across the investment community, we urge global standard setters such as the Glasgow Financial Alliance for Net Zero (GFANZ) to provide clear guidance.
We recommend that they revisit the grouping of scopes and look into treating scope 3 upstream in conjunction with scope 1 and 2 as upstream emissions, and then treat scope 3 downstream separately when aggregating emissions at portfolio level. This follows on from the fact that when the value chain is broken down into an upstream production phase (past emissions) and a downstream use phase (future emissions), scope 3 upstream seems conceptually closer to scope 1 and 2 than to scope 3 downstream.
We will explore the implications further in the third part of our three-paper mini-series, whilst in the second part we will investigate scope 3 data quality.
Footnote
1 For a clear overview of the different scopes please read the following: You, too, can master value chain emissions | Greenhouse Gas Protocol (ghgprotocol.org)