Chief Researcher


• Insight
Low-volatility evidence dating back to 1873
As new historical databases are opening up, there are great opportunities for out-of-sample tests of market anomalies. Research shows that the volatility effect also existed in the 19th century.
Authors


Head of Conservative Equities and Chief Quant Strategist
Summary
- New deep historical databases are opening up
- A great opportunity for out-of-sample tests of market anomalies
- The volatility effect exists in the 19th century as well
The large majority of all academic studies use the famous CRSP (Center for Research in Security Prices) database. This database is maintained by the University of Chicago. It contains all stock data for all US stocks listed on the New York Stock Exchange from 1926 onwards, followed by stocks listed on the American Stock Exchange (AMEX) and the technology-dominated NASDAQ exchange. This database is the longest and cleanest one can get at this moment. Still, it only covers a successful period for one country: the United States.
Increasingly, other databases are opening up and described in the empirical financial literature. Additional evidence is very important when assessing the robustness of factor premiums. For example, Dimson, Nagel, and Quigley (2003) have tested the value premium for the UK market over the period 1955-2001. Recently, Goetzmann and Huang (2015) studied a completely new database with stock returns from the St. Petersburg stock market. They show that momentum also worked in pre-revolutionary Russia over the period 1865-1914. Geczy and Samonov (2015) use a database for the US stretching from 1801 to 2012. They also document a momentum premium in the 19th century.
We welcome these new historical databases. They provide an additional opportunity to falsify an existing theory. A skeptical explanation for market anomalies is that they are just the result of luck or chance. Besides more recent out-of-sample evidence, a deep look into history could also be refreshing now and then and give insights into why an anomaly exists.
In this short article, we briefly discuss the main results for the low-volatility effect in the 20th century. We supplement this with fresh out-of-sample results for the low-risk effect dating back to the 19th century.
Discover the value of quant
Subscribe for cutting-edge quant strategies and insights.
20th century: US low-risk stocks outperform high-risk stocks
Low-risk stocks outperform high-risk stocks in the long term. We have documented the effect for Europe and Japan (2007) and emerging markets (2012). A nice overview of international evidence is given by Haugen and Baker (2012).
For this article, we have used the CRSP database and only included: (1) stocks with prices above USD 1 and (2) the largest 1,000 stocks. These strict criteria help to get to an investable database (only large caps) that is not affected by technical effects such as the bid-ask bounce. Stocks are sorted into ten portfolios based on historical 3-year volatility with a quarterly rebalancing frequency and portfolio returns are equal-weighted.
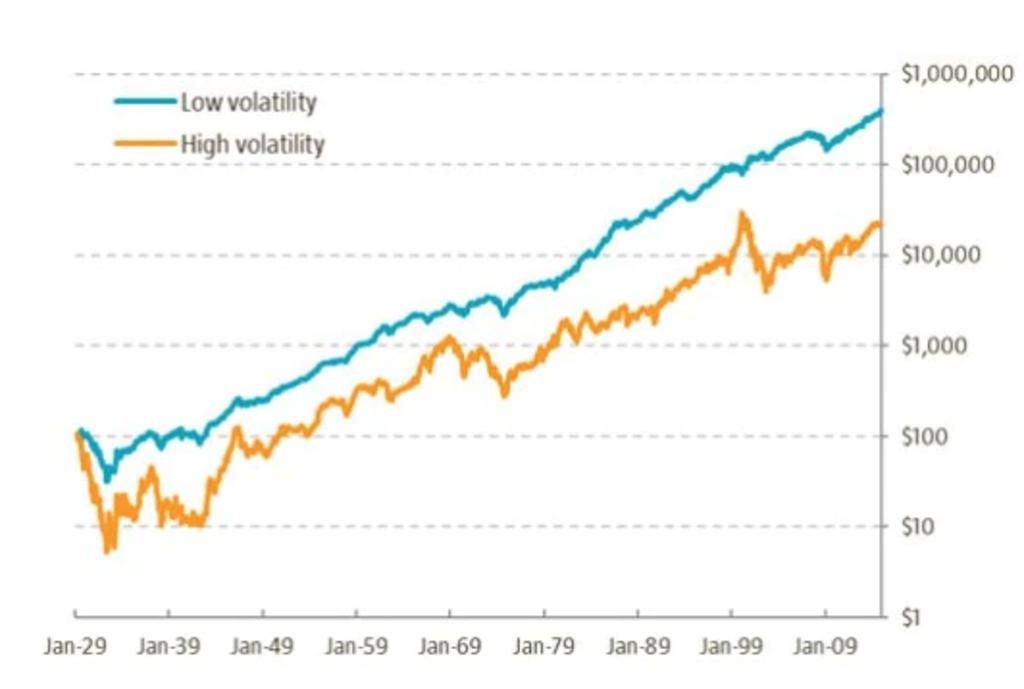
The figure below shows the cumulative performance of the low-volatility and high-volatility portfolio. Both portfolios consist of 100 stocks.
The puzzling result shown in Figure 1 is that low-volatility stocks outperform high-volatility stocks, while CAPM theory would predict the opposite. The annualized return difference is 4% and corrected for risk the CAPM alpha spread is 14%. 100 dollars invested in 1929 in low-volatility stocks would have grown to USD 400.000 in early 2015 while the investment in high-volatility stocks would be worth only USD 20.000. Low-volatility stocks would have made you 20 times richer than high-volatility stocks. Most striking is the very weak performance of high-volatility stocks.
Figure 1 | Cumulative performance of low/high volatility stocks 1929-2014
Source: Robeco Quantitative Research, CRSP
19th century: Belgian low-risk stocks outperform high risk stocks
The CRSP database includes the 1929 stock market crash and the subsequent Great Depression. But stock markets already existed well before the CRSP start data of 1926, and these forgotten decades also contain interesting bull and bear markets. For example, the big stock market crashes of 1873 and 1907 are often lacking in academic empirical studies.
To our knowledge, the only 19th century evidence for the low-risk anomaly is provided by Annaert and Mensah (2013). They show the existence of a low-beta effect in the Belgian stock market over the period 1873-1914. Today the Belgian stock market is relatively small (<1% of MSCI World), but at the end of the 19th century, it was one of the largest stock markets in the world. Belgium was the first country to take part in the Industrial Revolution on the European continent after Great Britain.
In their analysis, the Belgian professors analyze on average 237 stocks that were listed on the Belgian stock market and had at least two years of price data. They find evidence for the existence of a significant low-risk effect. Figure 2 shows the results of five portfolios sorted on market beta. The dotted line shows the risk-return relation as predicted by the CAPM, while the curved line shows the actual empirical relation between return and market beta. The line is first upwards sloping, but then going down sharply for high-beta stocks.
Figure 2 | Risk and return in the 1873-1914 period
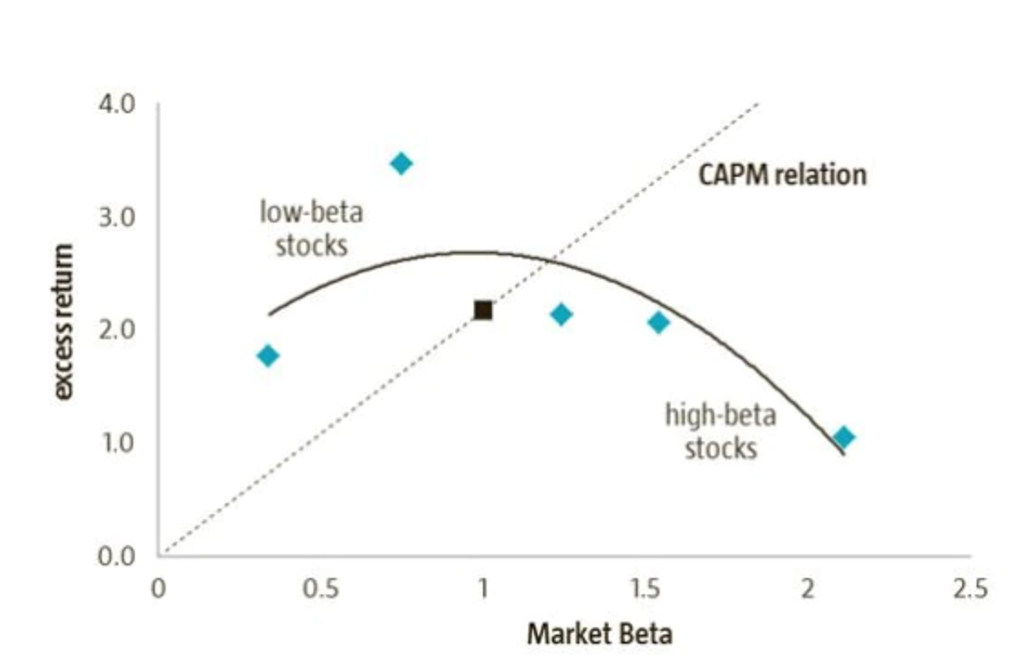
Source: Annaert and Mensah, 2013, data are from Panel E and G in Table 2
Low-risk stocks outperform high-risk stocks, also in the period 1873-1914. We like such ‘archeological finance’ research for two reasons.
First, the finding that low-volatility, momentum and value anomalies are also found to be present in this entirely new dataset makes it unlikely that these anomalies are merely a manifestation of data mining. That is good. One of the biggest risks for quantitative researchers is that they pick up spurious patterns, which are just a coincidence. That’s why we like long-term databases and rely on solidly proven factors.
Second, this new data can provide a better understanding of stock market anomalies. For example, in the 19th century hardly any money was managed by professionals and benchmarks did not exist yet. One explanation for the low-volatility effect is the dubious role of benchmarks, which create agency problems between asset owners and asset managers. This new evidence tells us that benchmarks cannot be the only explanation why low-risk stocks earn high-risk adjusted returns.