Head of Quant Fixed Income and Lead Portfolio Manager


• Insight
Quant chart: US Treasuries up for auction
Bond volatility presents opportunities for adding value through market timing. Our new research shows how novel duration signals can capture short-term inefficiencies, offering a diversifying alpha source for government bond strategies.
Authors






Portfolio Manager

Researcher
With a national debt of USD 36 trillion and a budget deficit of USD 307 billion in February alone, the US has to sell a substantial volume of bonds. Every month, the US Department of the Treasury sells approximately USD 40 billion in 10-year Treasury Notes at a single auction – followed the next day by an auction of over USD 20 billion in 30-year bonds. This sudden influx of new supply temporarily puts pressure on the market.
The future on the US 10-year Treasury Note is one of the most liquid instruments in the world, with up to 239,000 contracts exchanged in a single minute. Based on an intraday dataset consisting of 382 million transactions in this futures contract, we investigated the impact of these auctions. This fascinating dataset allows us to observe and analyse market movements with great precision.
The intraday chart in Figure 1 illustrates a clear pattern: ahead of the auction, on average futures prices decline by 6 basis points, only to recover in the hours that follow.
Figure 1 | Auction impact
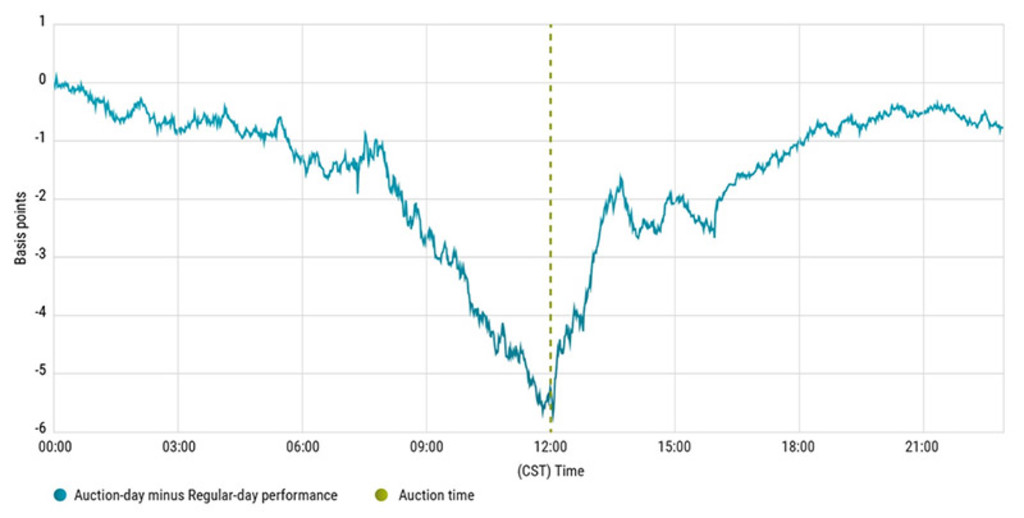
Source: Tickdata, TreasuryDirect. The figure shows the difference in the performance of the US 10-year T-Note futures on the day of a US 10-year auction vs a regular day. Sample January 1983 to August 2024.
Quant Charts
Turning market patterns into opportunity
We can benefit from this pattern by taking a short position in government bond futures ahead of the auction, and then switching to a long position just before prices begin to rebound. Our research identifies optimal positioning to efficiently capture this liquidity premium, while carefully taking risk considerations and transaction costs into account.
This auction-based strategy is the first shorter-term signal that we’ve implemented in government bond markets, adding a new, uncorrelated source of alpha to our long-standing Dynamic Duration strategy.
Read more in our recent article on bonds and market timing: Bonds are back: Mastering market timing for long-term success.
Discover the value of quant
Subscribe for cutting-edge quant strategies and insights.
Important information
This information is for informational purposes only and should not be construed as an offer to sell or an invitation to buy any securities or products, nor as investment advice or recommendation. The contents of this document have not been reviewed by the Monetary Authority of Singapore (“MAS”). Robeco Singapore Private Limited holds a capital markets services license for fund management issued by the MAS and is subject to certain clientele restrictions under such license. An investment will involve a high degree of risk, and you should consider carefully whether an investment is suitable for you.