Strategist



• Insight
The invisible hand that guides bond markets
Understanding the neutral interest rate at which an economy neither contracts nor expands has vexed investors for years. But once grasped, the r* rate can provide many opportunities in bond markets, say Martin van Vliet, Bob Stoutjesdijk, Rikkert Scholten and Philip McNicholas.
Authors




Strategist



Strategist
Summary
- Central banks use the r* neutral rate as a guide for setting rates
- R* depends on the interplay between savings supply and demand
- Our r* estimates are below those of the wider market
Policymakers at the European Central Bank (ECB) and US Federal Reserve frequently refer to the neutral rate or r*, confirming that central banks see it as a guide for interest rate policy. Understanding this theoretical concept is crucial not only for grasping cross-market differences in longer-term bond yields and yield curves, but also for identifying investment opportunities. However, because of its theoretical nature, this is a complicated process.
For any given market, r* estimates depend on a host of assumptions encompassing factors such as inflation, growth, fiscal prudence and demographics. Here, we discuss the drivers of r* and its direction of travel and present our own estimates of r* in comparison with market implied proxies.
Our r* estimates are below those of the market. While we agree with the view that an easier post-pandemic fiscal stance may be a factor in halting the secular downtrend in the neutral rate, we believe demographic shifts could keep it low, by historical standards, over the next five to ten years. This is particularly true for advanced economies and is shown in the graphic below.
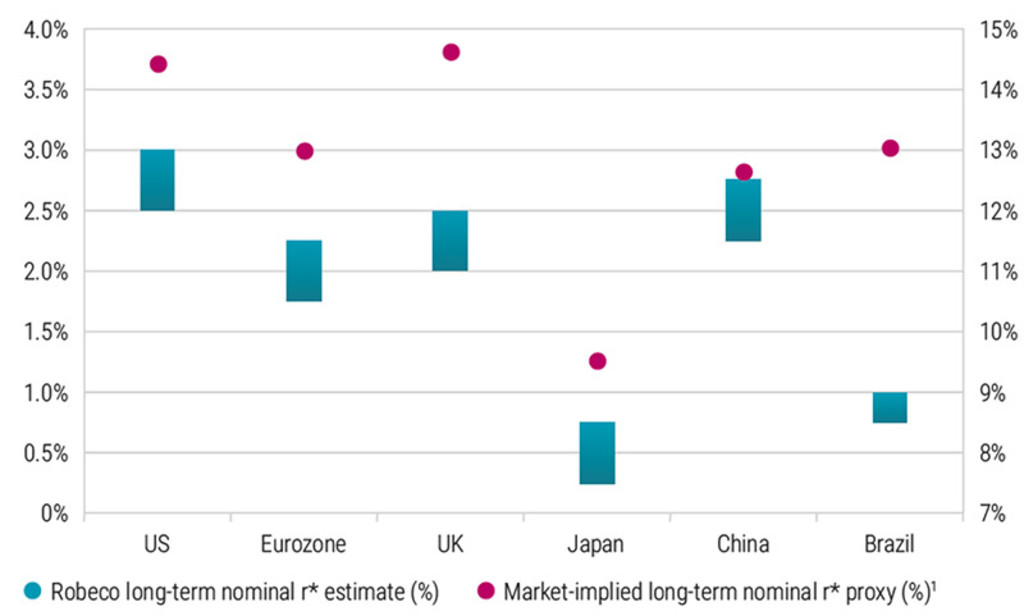
** 5y OIS 5y forward, except for China & Brazil (5y5y sovereign yield)
Robeco long-term nominal r* vs market-implied nominal r*. Source: Bloomberg, Federal Reserve, ECB, BoE, BoJ, BIS.
Many central banks are in the final stage of their tightening cycles, which were initiated to curb inflation. How high policy rates will go depends on incoming macro data, but if central banks succeed in steering inflation back towards their targets, policy rates are likely to reduce over time.
Indeed, this is what financial markets are discounting, and in the long run, after the economy has adjusted to any cyclical fluctuations, policy rates are expected to assume their equilibrium. This is the level at which monetary (interest rate) policy is considered neither accommodative nor contractionary, i.e. it neither stokes nor slows economic growth.
The difficulty for investors is that this long-run equilibrium policy rate, also called the neutral rate, or r*, is an unobservable theoretical construct and therefore must be estimated. Even so, it can – in the words of Bank of England Governor Andrew Bailey – “provide an indication of the general outlook for interest rates over the coming years,” especially because central banks use it as a point of reference. Indeed, ECB policymakers have frequently referenced the neutral rate in speeches over recent quarters, as have US Fed officials, including Chairman Jerome Powell.
R* is often referred to in ‘real’ or inflation-adjusted terms, as consumer and business investment decisions are typically affected by the level of borrowing costs that take into account the inflation expected to prevail during the life of the investment. Converting r* into a nominal variable thus implies adding a measure of inflation expectation.
A good example would be a central bank’s prevailing inflation target. An r* perspective can help to understand cross-market differences in longer-term bond yields and yield curves – and in assessing their future evolution.
Drivers of r* and its direction of travel
Put simply, r* depends on the interplay between the supply of savings and the demand for savings to fund investment. Many studies have documented that, due to an excess of desired savings over investments, r* has been on a secular downtrend since the end of the 1970s, as shown in the chart below.
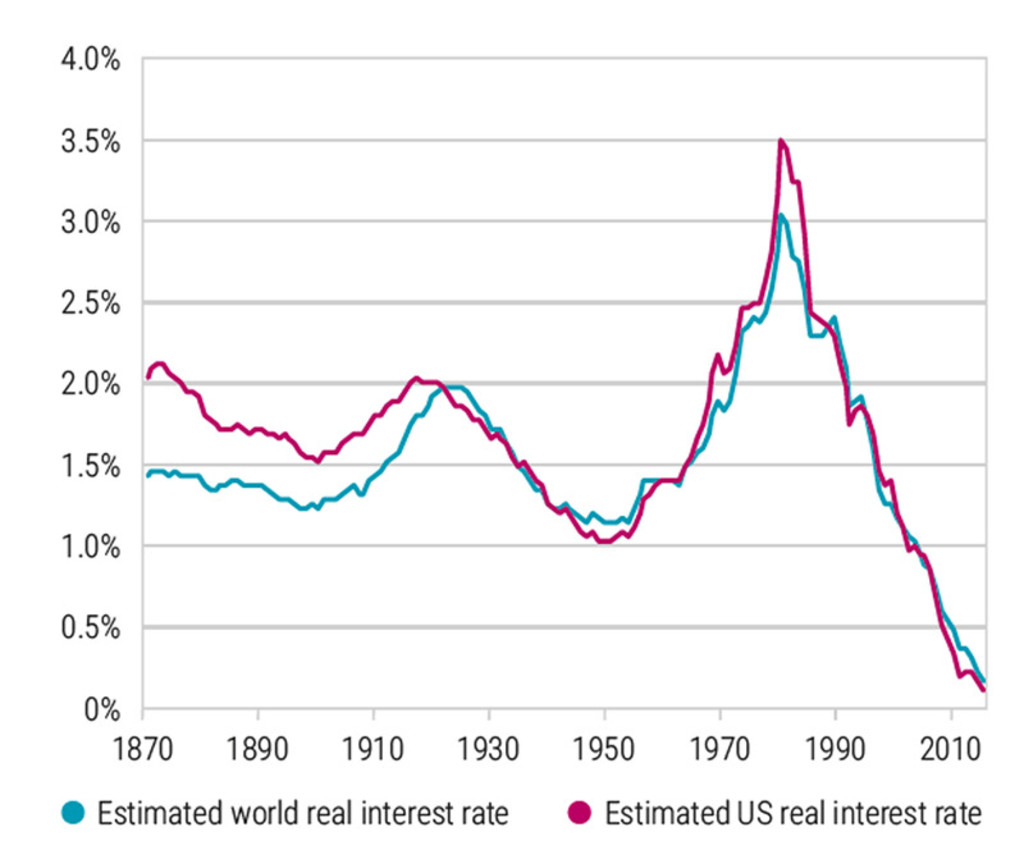
The long-term trend in the world and US real interest rate. Source: Del Negro et al. (2019) 1
A recent study by BoE researchers postulates that, from a global point of view, this decline was predominantly driven by two factors. 2 The first is an increase in longevity that pushed up desired savings of would-be retirees. The second is a slowdown in productivity growth that reduced demand for capital at a given interest rate because of lower potential returns on new investments. Good examples of countries where these two effects are evident are Japan and China.
Meanwhile, research shows that in advanced economies, a decline in population growth and increased inequality have amplified the decline in r*. 3 The latter is believed to have been due to the increased marginal propensity of higher income/wealth cohorts to save. They also estimate that increased government debt since the 1970s has dampened the secular decline in r*.
Such findings are corroborated by other research which shows that elevated sovereign debt supply between 2008 and 2019 has worked to push up the long-run r* in the US, Canada, the UK, and the Eurozone from earlier lows.4 A further rise in government debt since the pandemic may have reinforced this, as also suggested in two recent Fed studies.
This finding contrasts with the view that high and rising government debt tends to push down r* by increasing economic agents’ desire to save out of fear of future tax rises. We do suspect though, that at higher debt levels, financial stability could come under pressure at lower interest rate levels than otherwise would be the case.
Get the latest insights
Subscribe to our newsletter for investment updates and expert analysis.
Emerging markets experience
Studies for emerging market countries confirm the positive relationship between government debt and the level of r*, although here the causation seems to run via the credibility channel of monetary policy. Typically, countries with relatively high levels of government debt and twin deficits (i.e. a fiscal and current account deficit) run the risk of high imported inflation and it is up to the central bank to credibly prevent this.
Fiscal policy loosening will thus require a firm response by the central bank to counterbalance potential inflationary impulses and prevent the current account from weakening further by trying to keep the currency stable. Hence, r* is higher in such economies relative to those with lower government debt and more sound fiscal metrics – for example, with Brazil compared to Germany.
Looking ahead, we concur with the view that a generally looser fiscal regime since the pandemic may have helped break the secular downtrend in r*. One additional consideration, also flagged by the IMF in 2022, is the upward effect on r* from accelerating global investment to address climate change.
Nonetheless, in light of the lingering demographic trends we suspect that r*, certainly in advanced economies and by historical standards, is likely to remain low over the next five to ten years.
Footnotes
1Del Negro et al. (2019) “Global trends in interest rates”, Journal of International Economics, vol. 118, issue C.
2BoE Staff Working Paper, Decomposing the drivers of Global R*, July 2022
3Rachel, L. and L Summers (2019) “On secular stagnation in the industrialized world”, NBER Working Paper 26198
4Eggertsson, G. et al. (2019) “A model of secular stagnation: Theory and Quantitative evaluation”, American Economic Journal: Macroeconomics 2019; Ferreira, T. and C. Davin (2022) “Longer-run neutral rates in major advanced economies”, FEDS Notes
This article is an excerpt of a special topic in our five-year outlook.
Important information
This information is for informational purposes only and should not be construed as an offer to sell or an invitation to buy any securities or products, nor as investment advice or recommendation. The contents of this document have not been reviewed by the Monetary Authority of Singapore (“MAS”). Robeco Singapore Private Limited holds a capital markets services license for fund management issued by the MAS and is subject to certain clientele restrictions under such license. An investment will involve a high degree of risk, and you should consider carefully whether an investment is suitable for you.