Head of Solutions Research

• Insight
What valuations and interest rates tell us about equity factors
Single and multi-factor equity portfolios are currently very attractively valued and factor premiums persist across inMarket fears of stagflation have prompted Robeco’s multi-asset team to take some risk off the table and stash more cash.terest rate cycles.
Authors


Researcher


Researcher
Summary
- Value, Momentum, Low risk and Quality trade at enticing valuations
- Firm fundamentals of Value stocks have improved
- Factor premiums persist across interest rate cycles
Given the current market environment, numerous questions have cropped up regarding factor premium expectations. To address some of these, we delve into whether factors currently trade at attractive valuations and investigate the short and long-term relationship between factors and interest rates.
In terms of valuations, we generally find that the value, momentum, low risk and quality factors are trading at enticing levels relative to their history. To deduce this, we analyzed the valuation spread between the top and bottom quintile portfolios of the four factors, as shown in Figure 1. As we control for valuation differences that are normally observed between both portfolios, a valuation spread above 1 indicates cheapness and a valuation spread below 1 indicates that the factor is more expensive.
Figure 1 | Composite valuation spreads for the Value, Momentum, Low-risk and Quality factors
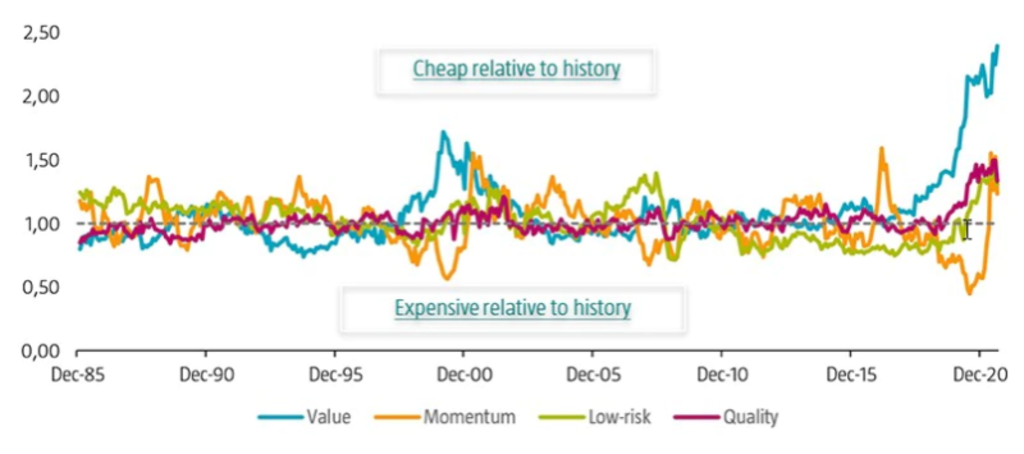
Source: Refinitiv.
The figure shows the composite valuation spread between the top and bottom quintile portfolios of the value, momentum, low-risk, and quality factors. The investment universe consists of constituents of the MSCI Developed and Emerging Markets indices. Before 2001, we use the FTSE World Developed index for developed markets (going back to December 1985), and for emerging markets, the largest 800 constituents of the S&P Emerging BMI at the semi-annual index rebalance (going back to December 1995). The sample period is January 1986 to August 2021.
When assessing these valuations, we believe it is important to frame the strong first-quarter performance delivered by value and its pullback thereafter, as well as to contextualize the recent sharp changes in the portfolio holdings of momentum strategies.
Value1, for one, initially saw a slight contraction in its spread following strong returns in the last quarter of 2020 and the first quarter of 2021. But more recently, the spread has widened again – scaling new highs in August 2021 – as the tepid second and third-quarter returns delivered by value stocks coincided with improvements in the operating performance (gross profitability and analyst earnings revisions) of the same companies.
On average, cheap stocks displayed gross profitability levels that were more than 3% higher than those of their expensive counterparts as at the end of August 2021. Meanwhile, earnings revisions for value stocks have been better than for their growth counterparts over the last few months.
In recent years, the momentum style has leaned heavily towards more expensive (growth) stocks. But this shifted very swiftly in March 2021, as momentum strategies became significantly tilted towards cheaper (value) stocks. As a result, the factor is now trading at attractive valuations. Note, however, that when the momentum factor experiences such sudden changes in its portfolio holdings, it can cause it to have a significant overlap with the value factor in terms of its underlying exposure.
Therefore, we believe it is vital to account for these dynamic style tilts when constructing the momentum factor in order to offer multi-factor investors a well-diversified portfolio and to reduce the risk of the momentum factor. For example, this can be accomplished by following a residual momentum approach.
In line with value and momentum, we also observed that low risk and quality have also become more attractively valued. For the latter two, this trend became quite apparent around the start of the Covid-19 pandemic.
Get the latest insights
Subscribe to our newsletter for investment updates and expert analysis.
Value is slightly responsive to yield increases in recent times
A topical issue is whether factor premiums are driven especially by falling yields, as we have seen over the last few decades, or whether they will benefit equally from rising interest rates. In particular, there is a growing dialogue around the possible connection between the value premium and yield changes nowadays.
Many investors inquire whether the recent value performance swings are instigated by increasing and declining yields. The typical argument is that as growth stocks exhibit longer duration than their value counterparts, they should benefit from a lower discount rate being applied to their cash flows and suffer from rising yields. We acknowledge this line of reasoning. Indeed, it is hard not to notice the apparent link between climbing yields and the rally in value stocks in the first quarter of 2021.
That said, we believe the key question is whether this apparent relationship is structural and can be embedded in portfolios. Several observations suggest it is not. Firstly, yields have generally declined since 1980 and value has performed well over the majority of this period. Secondly, value has been one of the strongest factors in Japan, despite a trend of falling and very low interest rates for more than 30 years. Thirdly, one could argue that value stocks are ‘bond-like’ as their prices are driven less by growth expectations and more by their earnings and dividend power in the years ahead.
In 2012, several Robeco authors2 found that value stocks tended to have a positive bond beta and usually benefited when yields dropped. This was particularly visible on an annual basis as value stocks typically performed well in the years in which bond yields fell. Furthermore, many of these explanations are also relevant to other factors, most notably low risk. Indeed, low-risk stocks are more ‘bond-like’ in nature, while their high-risk counterparts tend to be more speculative and driven by potential long-term growth considerations.
Therefore, an important question to answer is how stock factor premiums relate to yield changes. Figure 2 illustrates this by showing the t-statistic on the change in bond yields based on 10-year rolling regressions. We observed that the value factor tended to perform better in the months in which yields rose over the full sample period. However, this relationship is highly dynamic as the value factor was not significantly related to changes in bond yields before August 2011, but it became considerably linked in the last 10 years. Thus, the relationship is largely concentrated in the last decade.
Figure 2 | Factor premiums and their sensitivity to yield changes
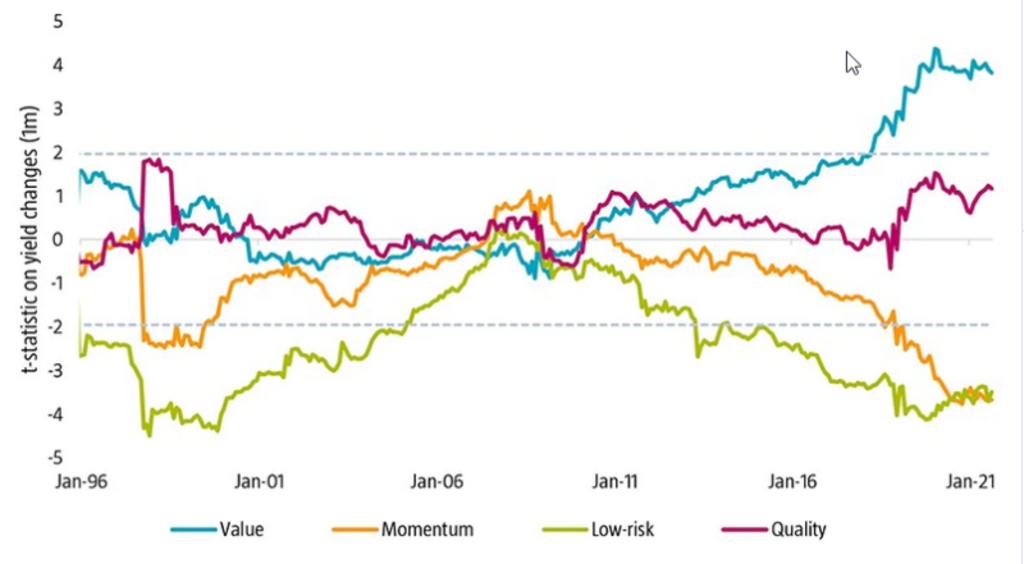
Source: Robeco, Refinitiv, Bloomberg.
The investment universe consists of constituents of the MSCI Developed and Emerging Markets indices. Before 2001, we use the FTSE World Developed index for developed markets (going back to December 1985), and for emerging markets, the largest 800 constituents of the S&P Emerging BMI at the semi-annual index rebalance (going back to December 1995). Regressions use 10-year rolling yield changes and include the global equity market return as a control variable. The sample period is January 1986 to August 2021.
Interest rate sensitivities vary across factors and are economically small
Interestingly, other factor premiums also have a dynamic relationship with yield changes, as illustrated in Figure 2. Low risk had a somewhat negative link, albeit limited, as highlighted in earlier publications on the low-risk factor.3 However, this was not uniform over the sample period as the connection was largely absent around the 2000s. Moreover, these sensitivities are less prevalent in our enhanced low-risk portfolios as we account for other factor exposures and explicitly manage interest rate sensitivity.
Momentum was negatively related to yield changes over the full sample period. But similar to value, this effect seemed to be mostly concentrated in the last years of the sample. Finally, quality returns were generally unrelated to yield changes over the entire interval.

Interest rate sensitivities diminish over longer horizons
Over the full and more recent sample period, we also found that none of the factor premiums had an economically significant exposure to annual yield changes, indicating that any relationship is relatively short-lived. Therefore, we can conclude that most factor premiums do not have a stable or economically material relationship with bond yield changes on an annual basis.
Ultimately, we believe there is a salient takeaway from our analysis. In our view, having exposure to multiple factors in a portfolio does not only diversify individual factor and stock risks, but also factor sensitivities to yield movements as these vary widely across factors and time.
Footnotes
1We define value as in Blitz, D. C., and Hanauer, M. X., January 2021, “Resurrecting the value premium”, Journal of Portfolio Management. More specifically, the enhanced value strategy is based on a composite of book-to-market (R&D adjusted), EBITDA/EV, CF/P, and NPY metrics. Value stocks are sorted into quintile portfolios based on the valuation composite, in a region and sector neutral manner for developed markets and in a country neutral manner for emerging markets. Quintile portfolios are equal-weighted and rebalanced monthly. Our sample comprises the standard MSCI All Countries Index constituents, i.e., large and mid-cap stocks across both developed and emerging markets
2See: Baltussen, G., Post, T., and Van Vliet, P., February 2009,”Downside risk aversion, fixed income exposure, and the value premium puzzle”, Journal of Banking and Finance 36, p.3382-3398.
3See: Blitz, B., Van der Grient, B., Van Vliet, P., June 2014, “Interest rate risk in low-volatility strategies”, Robeco article.