Portfolio Manager


• Insight
Navigating bond markets in times of stagflation
High inflation and central bank tightening are already leading to rising yields and negative bond returns. At some point, though, higher yields and weaker growth will offer opportunities for bond investors.
Authors



Summary
- Bond markets torn between high inflation and weaker growth
- Deep-sample evidence includes high inflation and stagflation periods
- Dynamic Duration strategy well-positioned for current challenging environment
Stagflation is hitting the headlines again: high inflation and central bank tightening are already leading to rising yields and negative bond returns. At some point, though, higher yields and weaker growth will begin to offer opportunities for bond investors. To capture these opportunities when they arise, while also protecting portfolios against rising yields, active duration management is needed. But how do we know whether a strategy that was successful in recent decades will also work in a completely different environment?
To answer this question, we use the long-term back-test described in our academic paper ‘Predicting Bond Returns: 70 Years of International Evidence’. The back-test demonstrates that quant duration management works in an environment of high inflation and weak growth. Typically, it works best when bond markets move most – a positive finding given that the current environment is likely to cause significant market moves.
The risk of stagflation is clear as commodity prices have surged due to the war in Ukraine, and energy supply is threatened. US inflation has already reached levels unseen since the early 1980s and growth will be weaker as high energy prices hurt disposable income and force energy-intensive companies to reduce their production. Strict lockdowns are again implemented in economically important parts of China, while Covid-related supply chain disruptions and chip shortages are already limiting growth. Fiscal policy might cushion demand, but the resulting higher bond issuance could push yields even higher. Monetary policy has supported the growth rebound from the 2020 lows, but this support is now being withdrawn.
Back-test using a deep historical dataset
Robeco’s Dynamic Duration strategy aims to protect against rising yields and benefit from declining yields. Since its inception in 1998, the duration positioning of this strategy has been determined by a quantitative model. When the research leading to the creation of this model was performed in the early 1990s, the limited availability of historical bond market data was one of the challenges. Most academic research on bond market timing uses data sets starting in the early 1980s, a period characterized by a secular decline in interest rates. Periods of high inflation or stagflation are rare in these data sets and, as a result, evidence for bond market timing in such conditions was scarce.
In recent years, however, a much wider set of historical financial market data has been made available, thanks to researchers digitalizing archives of exchanges, central banks and newspapers. We recently published a paper in which we present evidence for bond market timing using a deep historical dataset. This back-test includes decades with higher inflation and periods of stagflation. In this article, we use the dataset from that paper to analyze the performance of bond market timing in different growth and inflation regimes, including periods of stagflation.
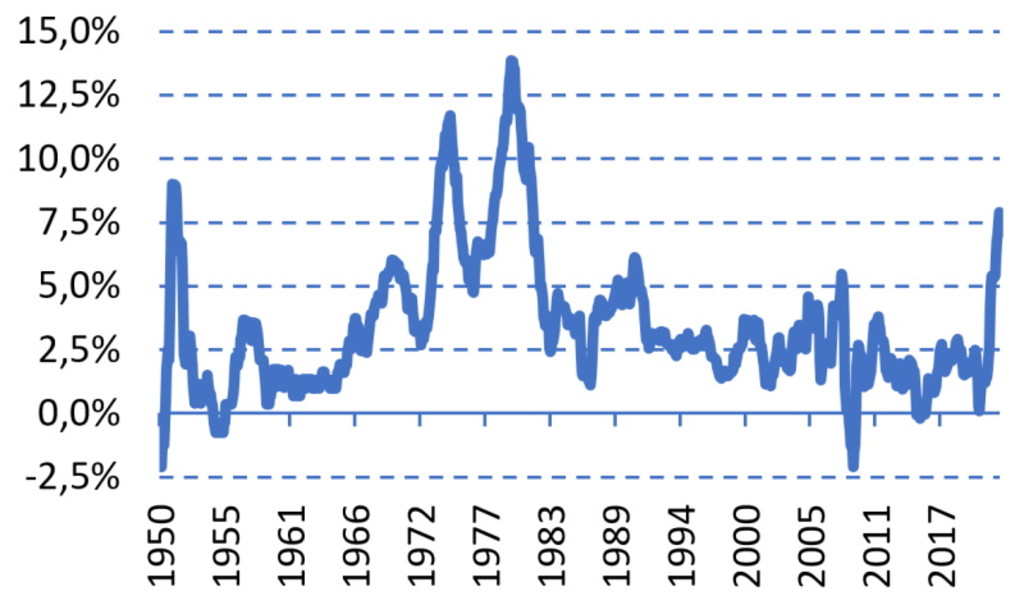
Figure 1 | US inflation, 1950 – February 2022
Source: Bloomberg, Datastream, Global Financial Data
Figure 1 shows the development of US inflation from 1950, and we can see immediately why we need to examine more than just the most recent decades: current inflation is higher than anything seen since the early 1980s. The combination of high inflation (above 4%) and a recession is very rare in recent decades, occurring in less than 5% of the time after 1982.
Our deep sample allows us to better study stagflationary environments: these occurred 23% of the time in the 1950-1982 period, mainly between the late 1960s and the early 1980s. We use a global dataset that includes six large bond markets (the US, UK, Germany, Japan, Australia and Canada) to study bond market timing all the way back to 1950.
Get the latest insights
Subscribe to our newsletter for investment updates and expert analysis.
Performance in times of stagflation
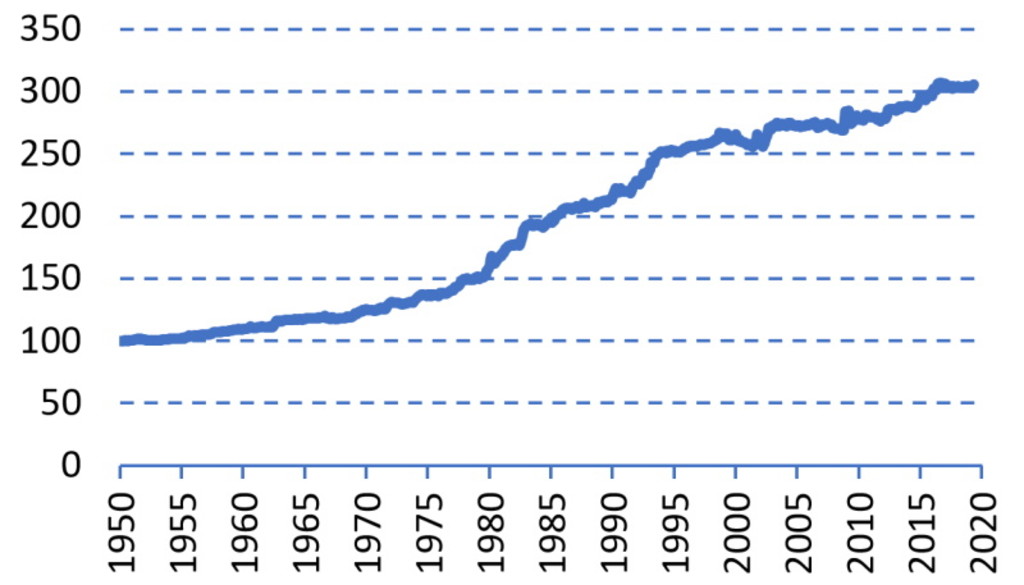
Our academic paper shows that bond market returns can be predicted using a combination of four variables: bond trend, yield spread, equity return and commodity return. This finding is robust over markets and over time periods. Figure 2 shows the cumulative back-tested performance of this strategy.
Figure 2 | Cumulative back-tested performance, 1950-2019
Source: Robeco
This figure indicates that the back-tested performance is good in the period with rising yields before 1982, as well as in the period of the secular decline in yields after that. In the paper, we provide formal evidence that the strategy’s performance is good in both these sub-periods, in recessions and expansions, and in periods of high inflation and low inflation.
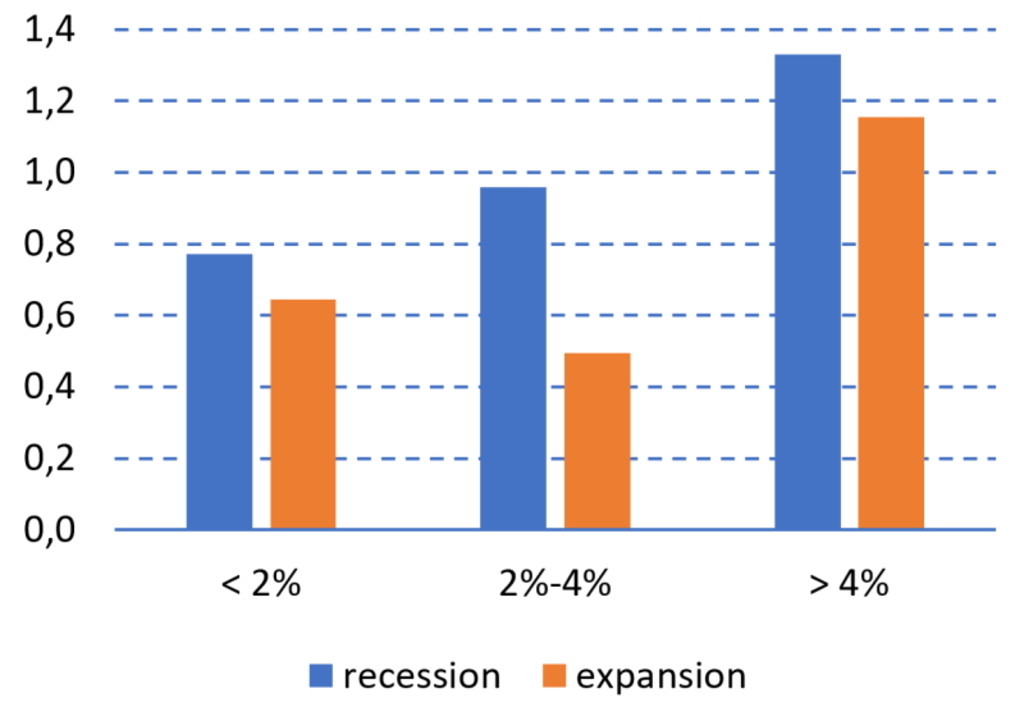
In this article, we now take that analysis one step further by classifying periods based on a combination ofgrowth and inflation. We distinguish periods with low, moderate and high inflation (below 2%, between 2% and 4%, and above 4%) in recessions, and do the same for expansions (following the same classification of recessions as in our academic paper). Figure 3 shows the model performance in these 3 x 2 = 6 categories.
Figure 3 | Model Information ratio in times of recession and expansion, and different inflation levels
Source: Robeco. Period: 1950-2019
The blue bars denote the information ratio of the bond market predictability strategy in recession periods, the grey bars in periods of expansion, with the bars (from left to right) showing the results in periods with low, moderate and high inflation. The figure shows that the back-tested strategy worked in all environments. Bond market predictability is especially strong in periods of stagflation, where inflation is high in a recession.
Adding most value when markets move most
The strategy’s strong performance in times of stagflation is in line with the academic paper’s general conclusion that the strategy also works well in adverse economic and market environments, for example in periods with falling equity markets. Typically, the model generates most return when bond markets move most – also because its signals are more reliable (higher success ratio) in periods when markets move strongly. The Dynamic Duration strategy has also generated above-average outperformance in the periods with the largest moves in bond markets (for up as well as down moves) throughout its 24-year live track record.
The current environment combines several potential drivers of strong moves in bond markets: high inflation, central bank tightening and increased bond issuance (to fund investments in defense and alternative energy supply) could push yields higher, while these higher yields and downside risks to growth could also offer opportunities for bond investors. Dynamic duration management can help to navigate these markets, both to offer protection against rising yields and to benefit when bonds rally again. The deep-sample back-test described in our academic paper shows that bond market timing works well in adverse environments, including during periods with high inflation and low growth.
Important information
THIS WEBSITE IS SOLELY INTENDED FOR PROFESSIONAL INVESTORS, WHICH HAS THE MEANING ASCRIBED TO IT IN THE SECURITIES AND FUTURES ORDINANCE (CAP. 571 OF THE LAWS OF HONG KONG) AND ITS SUBSIDIARY LEGISLATION. Investment involves risks. Past performance is not indicative of future performance. The information contained in this website is provided for reference only and does not constitute investment advice or an offer or solicitation to buy or sell in any securities or to adopt any investment strategy. Investors should not base their investment decisions solely on the information provided on this website and are advised to seek independent advice (including advice on tax implications) before making any investment decisions. Investors should ensure they fully understand the risks associated with the investment products and should also consider their own investment objectives and risk tolerance level. The investment decision is yours. You should not invest unless the intermediary who sells you the investment products has advised you that it is suitable for you and has explained how it is consistent with your investment objectives. Please refer to the relevant offering documents or other legal documents for further details including the risk factors. This website is published by Robeco Hong Kong Limited which is regulated by the Hong Kong Securities and Futures Commission (“SFC”) (CE No. APU851). This website has not been reviewed by the SFC. No assurance can be given that the investment objective of any investment products will be achieved. No representation or promise as to the performance of any investment products or the return on an investment is made. The value of investments may fluctuate. Past performance, projections, or forecasts included in this website should not be regarded as guarantees or indications of future performance, and no express or implied warranty is provided. The contents of this website are based on sources believed to be reliable, but due to the nature of information delivery technology and the necessity of using multiple data sources, including third party content, their accuracy is not guaranteed. The opinions expressed are as of the date shown above and may change as market conditions evolve, and are subject to change without notice. These opinions may differ from those of other Robeco investment professionals. Robeco accepts no liability for any direct, indirect, or consequential loss arising from the use of this material or any comments, opinions, or estimates contained herein. Robeco has no duty to update this website or any website content. Materials on this website may not be reproduced, distributed, or published without prior written permission from Robeco. Unless otherwise specified, Source: Robeco.