19-08-2021 · Column

The CO₂lumnist: Market versus location-based scope 2 emissions

Investors rely on data to make decisions on climate strategy, but emissions data can have smoke coming out of the ears of frustrated investors. In the third of a new series of columns taking a more light-hearted look at the issue, Robeco data scientist Thijs Markwat makes the case for paying more attention to scope 2.

    Authors

  • Thijs Markwat - Climate Data Scientist

    Thijs Markwat

    Climate Data Scientist

Many carbon discussions at the moment are about the quality and inclusion of scope 3 or which denominator to use in normalizing footprints. However, I think that scope 2 should also deserve some more attention. First let me start with a very quick recap:

  • Scope 1 are the direct emissions that come from the company by burning fossil fuels

  • Scope 2 are the emissions that stem from electricity purchased from utility providers1

  • Scope 3 emissions are all the other indirect emissions that occur along the value chain.

Thus, scope 2 are indirect emissions from electricity that is generated somewhere else. Depending on how this electricity was generated, these emissions can be higher or lower. According to the Greenhouse Gas Protocol, there are two methods available for calculating the carbon footprint of scope 2 emissions:

  • Market-based (MB): emissions calculated using emission factors from contractual instruments

  • Location-based (LB): emissions calculated using the average emissions intensity of the grid.

Thus, LB scope 2 reflects what you physically get via the electricity grid, and MB scope 2 reflects what you have actually purchased. Next, we will look at how MB and LB scope 2 are empirically related. We use company reported data from CDP for the analysis. In total there are 2708 companies that report their LB scope 2. Of those, 1516 companies (56%) also reports a MB scope 2. Big companies tend to report MB scope 2 more often than small companies. The chart below shows a scatter plot between LB and MB scope 2 for all companies that report both types of scope 22.

image.png

On the bottom of the chart we see companies that have a substantial LB scope 2 but a zero MB scope 2. Those companies generally have settled contracts with renewabe energy providers, or have offset emissions via contracts with other parties. The grey line indicates an equal MB and LB scope 2.

Of all companies, 71% report a lower MB scope 2, 21% report a higher MB scope 2, and 7% report exactly the same number for MB and LB. At first I found it pretty striking that 21% of the companies report a higher MB than LB scope 2. I always had this supposition that MB scope 2 should be lower than LB scope 2, as I would simply not expect a company to buy dirtier electricity than what it physically gets delivered via the grid. But then I realized that of course not everybody can buy cleaner energy than the average.

Even more, I might actually be starting to take the opposite view, and wonder why by far the most mass in the chart is below the diagonal. If most companies seem to use a much cleaner electricity mix than the average, then who is using the dirtier electricity? Of course, there will be a reporting bias, with cleaner companies more prone to also report MB scope 2. In addition, it could be that small business, households and governments are net users of the dirtier energy.

Furthermore, there might be some error in reporting. For instance, it is suspicious that for 7% of the companies the MB and LB scope 2 are exactly equal. All in all, I would say that really understanding MB scope 2 is not directly straightforward, and also for scope 2 there are still many questions to resolve.

Footnotes

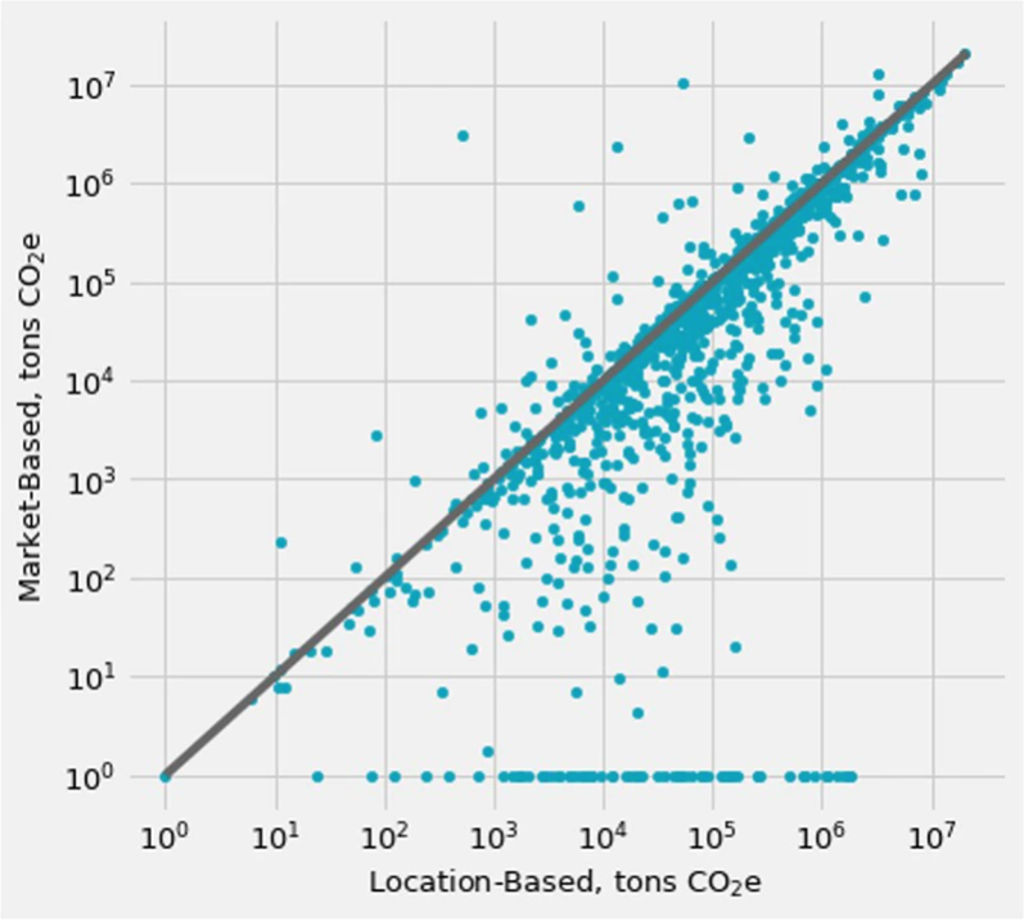
1Purchased steam, heat, or cooling are also scope 2, but for this note we focus on electricity.
2The chart shows 1 + emissions as we needed to plot zero emission values on a log scale.

Stay informed on Sustainable investing

Receive our Robeco newsletter and be the first one to get the latest insights or build the greenest portfolio.

Read more

Let's keep the conversation going

Robeco is an international asset manager offering an extensive range of active investments, from equities to bonds.

Read more
Robeco

Robeco aims to enable its clients to achieve their financial and sustainability goals by providing superior investment returns and solutions.

Important information: This website is prepared and issued in Australia by Robeco Hong Kong Limited (ARBN 156 512 659) (‘Robeco’) which is exempt from the requirement to hold an Australian financial services licence under the Corporations Act 2001 (Cth) pursuant to ASIC Class Order 03/1103. Robeco is regulated by the Securities and Futures Commission under the laws of Hong Kong and those laws may differ from Australian laws. The information on this web page is provided to you because Robeco reasonably believes that you are a "wholesale client" within the meaning of that term under section 761G(4) of the Corporations Act 2001 (Cth) ("Corporations Act") and not any other class of persons. This information is not an advertisement and is not intended to induce retail clients to acquire Robeco products. Retail clients who are interested in Robeco products should contact their financial adviser.