
Yearly Outlook
Robeco Africa
Who we are
In Africa, we tailor our solutions to meet your unique needs. As a global asset manager driven by research and a commitment to sustainability, we guide you towards innovative investment strategies. We are here to share knowledge to support skills transfer and transformation. Are you looking to invest in ways that address today's challenges and future opportunities? Our shared goal is to ensure that our investments generate alpha and support a thriving planet and society. Join the conversation and connect with us.
Thabo Tembo - Head of Africa Distribution, Robeco


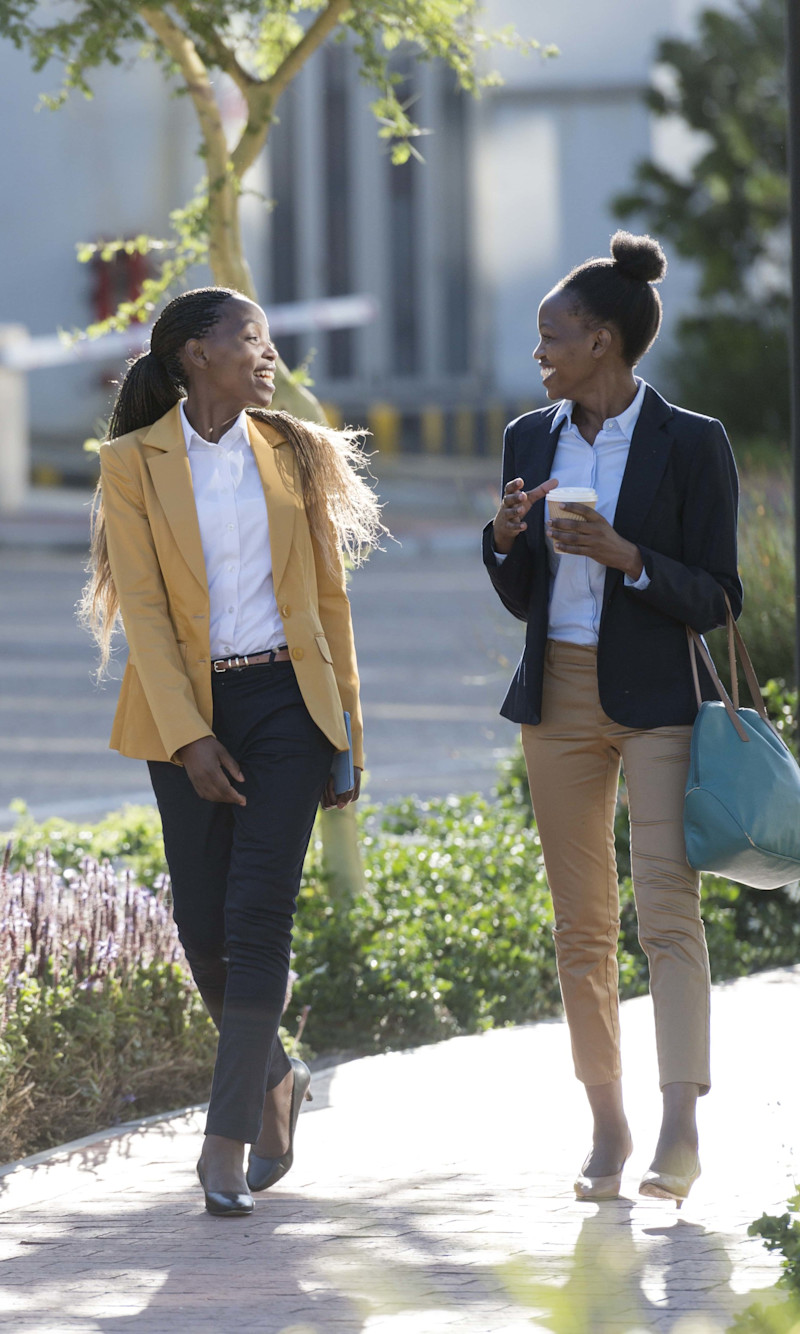


Helping children reach their full potential
The Robeco Foundation promotes equal opportunities for children worldwide by supporting local programs in Robeco-active countries. It aids disadvantaged children through educational and other initiatives.
In Africa, the foundation collaborates with Room to Read, a non-profit focused on girls' education and children's literacy in Asia and Africa. Our donation supports a three-year program at a primary school in South Africa, near our client base.
Our latest insights


A taste of our strategies

Emerging Markets Equities
Over 90 years of pioneering
Sustainable Index Solutions
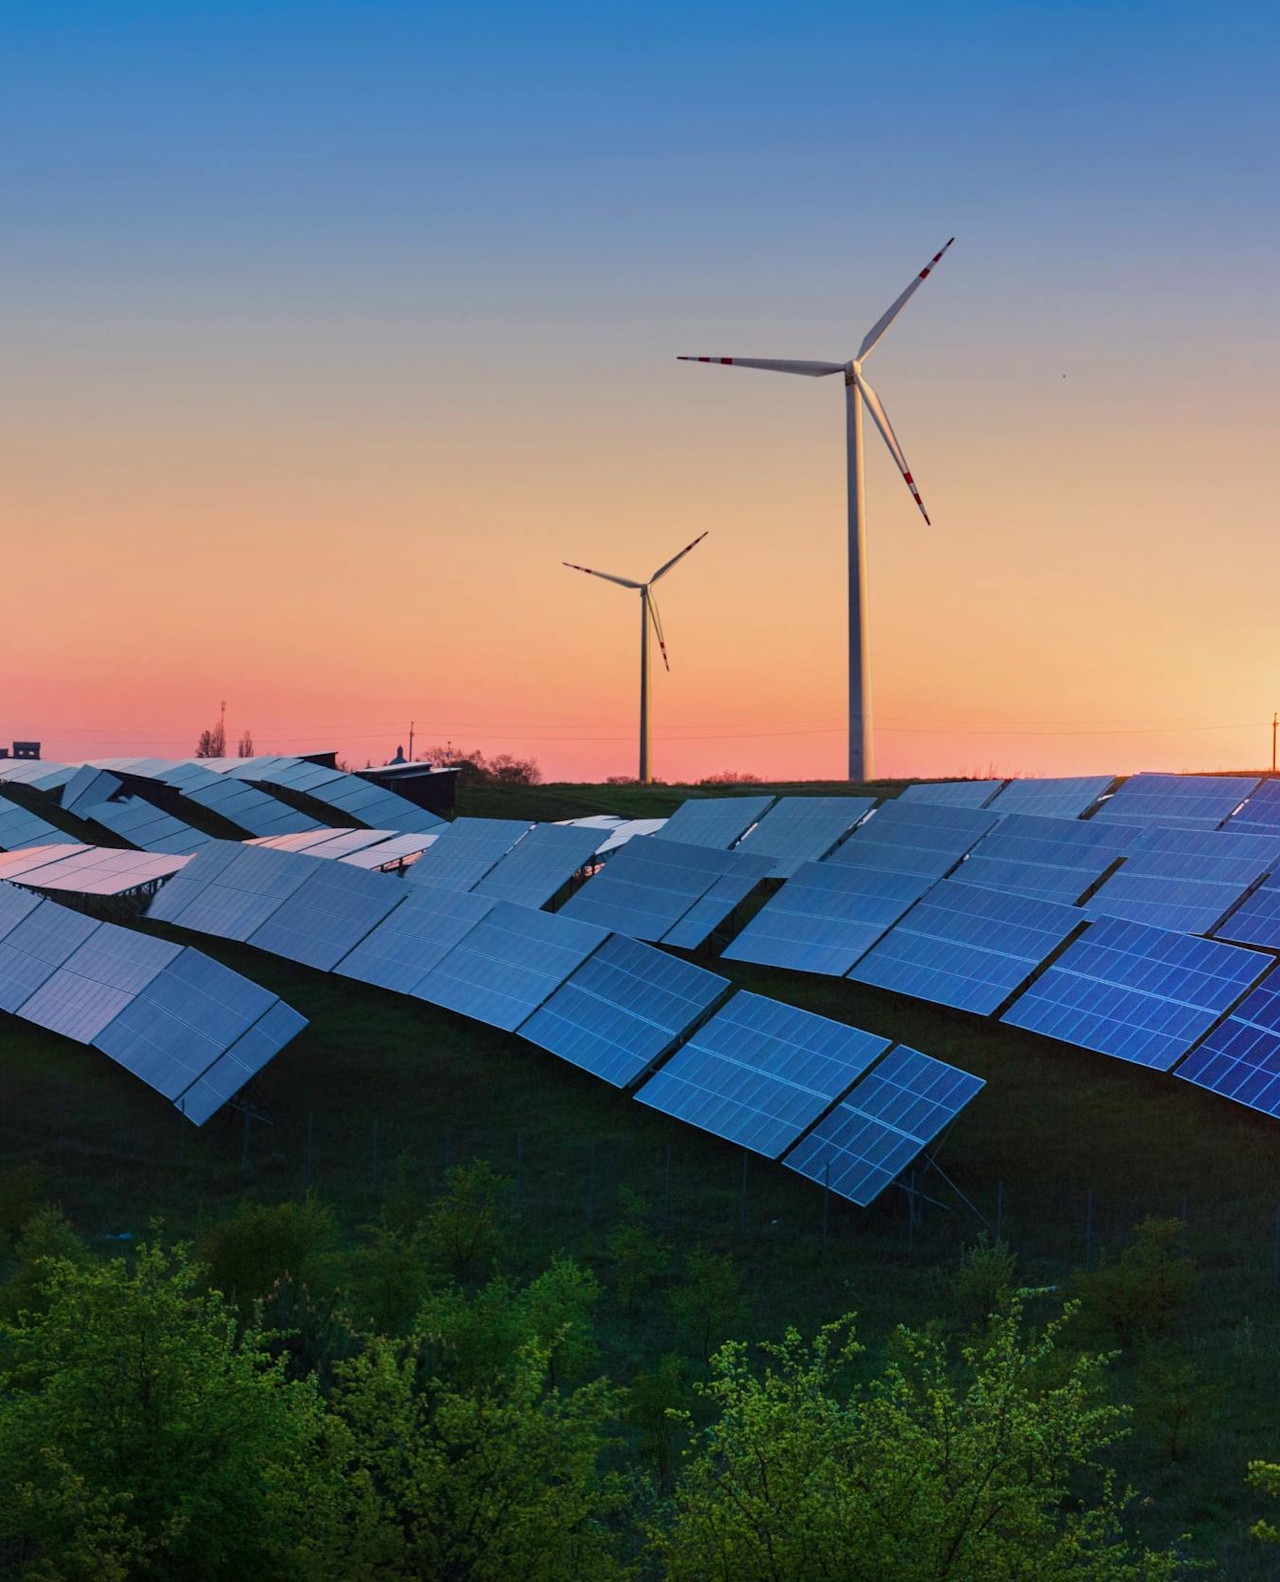
Taking high-impact, low-carbon solutions to the next level

SDG Investing
The Sustainable Development Goals are the blueprint for sustainable investing