Robeco logo

Important information

The Robeco Capital Growth Funds have not been registered under the United States Investment Company Act of 1940, as amended, nor or the United States Securities Act of 1933, as amended. None of the shares may be offered or sold, directly or indirectly in the United States or to any U.S. Person (within the meaning of Regulation S promulgated under the Securities Act of 1933, as amended (the “Securities Act”)). Furthermore, Robeco Institutional Asset Management B.V. (Robeco) does not provide investment advisory services, or hold itself out as providing investment advisory services, in the United States or to any U.S. Person (within the meaning of Regulation S promulgated under the Securities Act).

This website is intended for use only by non-U.S. Persons outside of the United States (within the meaning of Regulation S promulgated under the Securities Act who are professional investors, or professional fiduciaries representing such non-U.S. Person investors. By clicking “I Agree” on our website disclaimer and accessing the information on this website, including any subdomain thereof, you are certifying and agreeing to the following: (i) you have read, understood and agree to this disclaimer, (ii) you have informed yourself of any applicable legal restrictions and represent that by accessing the information contained on this website, you are not in violation of, and will not be causing Robeco or any of its affiliated entities or issuers to violate, any applicable laws and, as a result, you are legally authorized to access such information on behalf of yourself and any underlying investment advisory client, (iii) you understand and acknowledge that certain information presented herein relates to securities that have not been registered under the Securities Act, and may be offered or sold only outside the United States and only to, or for the account or benefit of, non-U.S. Persons (within the meaning of Regulation S under the Securities Act), (iv) you are, or are a discretionary investment adviser representing, a non-U.S. Person (within the meaning of Regulation S under the Securities Act) located outside of the United States and (v) you are, or are a discretionary investment adviser representing, a professional non-retail investor. Access to this website has been limited so that it shall not constitute directed selling efforts (as defined in Regulation S under the Securities Act) in the United States and so that it shall not be deemed to constitute Robeco holding itself out generally to the public in the U.S. as an investment adviser. Nothing contained herein constitutes an offer to sell securities or solicitation of an offer to purchase any securities in any jurisdiction. We reserve the right to deny access to any visitor, including, but not limited to, those visitors with IP addresses residing in the United States.

This website has been carefully prepared by Robeco. The information contained in this publication is based upon sources of information believed to be reliable. Robeco is not answerable for the accuracy or completeness of the facts, opinions, expectations and results referred to therein. Whilst every care has been taken in the preparation of this website, we do not accept any responsibility for damage of any kind resulting from incorrect or incomplete information. This website is subject to change without notice. The value of the investments may fluctuate. Past performance is no guarantee of future results. If the currency in which the past performance is displayed differs from the currency of the country in which you reside, then you should be aware that due to exchange rate fluctuations the performance shown may increase or decrease if converted into your local currency. For investment professional use only. Not for use by the general public.

I Disagree

02-20-2024 · Insight

Real-life experience: Using ML and distance-to-default to predict distress risk

Tail risk is extremely relevant for investors. While small wins and losses are inherent to stock market investing, significant price crashes can be highly detrimental. Identifying stocks that are likely to experience severe price crashes is crucial.

    Authors

  • Tobias Hoogteijling - Researcher

    Tobias Hoogteijling

    Researcher

  • Pim van Vliet - Head of Conservative Equities and Chief Quant Strategist

    Pim van Vliet

    Head of Conservative Equities and Chief Quant Strategist

Summary

  1. ML risk and distance-to-default signals are strong tail risk predictors

  2. Since strategy inception, these signals have beaten standard risk factors

  3. Our year-by-year analysis includes real-life stock examples

Traditional risk indicators like stock beta and return volatility are useful but limited as they rely on historical data. To better estimate tail risk, Robeco has incorporated advanced measures such as distance-to-default (DtD) since 2011, and more recently in 2021, a machine learning (ML) risk signal that identifies complex market patterns. This note reviews their performance, particularly focusing on out-of-sample results. It demonstrates that DtD and ML signals have outperformed traditional measures in real-life investment strategies, supported by practical examples and analysis.

What are the DtD and ML signals?

The distance-to-default (DtD) signal, inspired by the Merton model1 , captures how close a firm is to defaulting on its debt. It’s a key concept in credit risk modelling, used by analysts and bond investors to assess a company's financial stability and the likelihood of credit default. In this model, stock equity is seen as a call option on the company's total value, including liabilities. This value is influenced by the volatility of the company's asset market value. The forward-looking nature of DtD offers additional insights compared to traditional metrics. Since 2011, an enhanced version of this proprietary distress risk measure is a negative screening tool for all our Quantitative Equity strategies, and has been integral to our stock selection model for Conservative Equities.2

The machine learning risk signal, introduced to our Quantitative Equity models in 2021, is trained to identify firms likely to suffer severe stock price crashes. ML techniques have several advantages, such as adapting to data patterns and capturing complex relationships like nonlinearities and interaction effects.3 For example, the empirical relationship between a firm’s financial leverage and its risk level is not linear. While firms with low or average leverage tend to have an average distress risk, those with high leverage are much more likely to experience significant price crashes. ML techniques excel at identifying such nonlinear relationships. 4

Data and analysis

Our evaluation focuses on comparing the out-of-sample performance of three distress indicators since their incorporation into real-life investment strategies:

  1. 50/50 combination of beta and volatility

  2. DtD signal

  3. ML distress signal


For this we include a year-by-year analysis, examples of individual stock price crashes, power curves and portfolio sorts.

Year-by-year analysis: Since integrating DtD into Robeco's strategies in 2011, the annual performance of the riskiest stocks has been tracked. In strong market years like 2013 and 2019, these stocks sometimes outperformed the market. However, during downturns (e.g., 2018 and 2022), as expected the high DtD stocks suffered more significant losses.Notably, during negative market years, emerging markets experienced more substantial drawdowns than developed markets. On average, DtD outperformed traditional beta/volatility measures by about 2 to 3% annually in both developed as well as emerging markets.

Individual stock examples: In 2022, many companies experienced substantial drops in market value, with the top ten losers declining by an average of 69.8%. Noteworthy cases include Silicon Valley Bank and Snap, which had poor DtD and ML risk signal scores at the beginning of the year. This highlights how DtD and ML can effectively predict individual stock crashes complementing traditional risk factors.

Power curves: A statistical tool commonly used to assess prediction accuracy is the power curve. In this analysis, all three indicators (beta & volatility, DtD, and ML) outperformed the no-predictability benchmark. The power curves for DtD and ML were further from the 45-degree line than the beta & volatility curve, indicating their superior predictive power. The ML signal had the highest area under the curve (AUC) score, followed by DtD and then the beta-volatility combination.

Figure 1 | Power curves for various predictors of distress

Figure 1 | Power curves for various predictors of distress

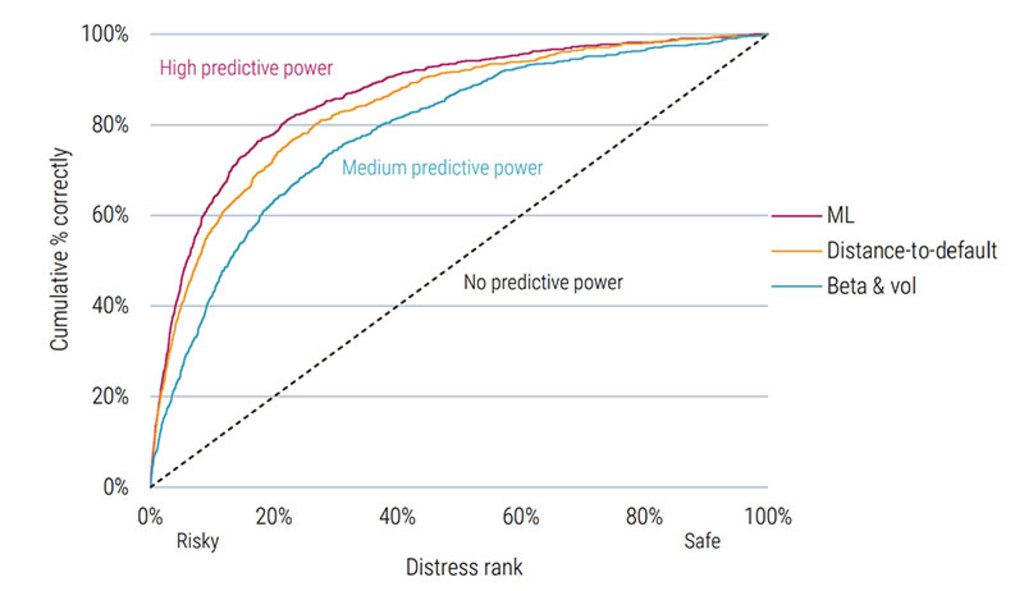
Global Developed Markets 2002-2023. Source: Robeco, MSCI, DataStream, Compustat and Worldscope, 2023.

Portfolio sorts: The analysis examined the 10% of stocks with the highest risk scores (beta & volatility, DtD, and ML). Stocks in these high-risk portfolios typically underperformed the market. The underperformance was more pronounced for DtD and ML compared to the beta-volatility basket. This indicates that advanced measures like DtD and ML are more effective in detecting risky stocks, and avoiding or shorting these stocks has historically led to higher returns.

Conclusion

This article presents detailed evaluations of proprietary tail risk predictors used in all of our Quantitative Equity strategies in general and Conservative Equities in particular, focusing on the comparison between traditional and advanced measures. Our analysis, which includes a year-by-year review, individual stock examinations, power curves and portfolio sorts, indicates that DtD and ML risk signals have added a distinct dimension to risk prediction since their inclusion in 2011 and 2021 respectively. These findings suggest a potential for improved identification of distressed stocks, which is a key consideration in strategy development and risk management.

Download full publication


Footnotes

1 Merton, R. C. (1974). On the pricing of corporate debt: The risk structure of interest rates. The Journal of finance, 29(2), 449-470.
2 How distress risk improves low volatility strategies: lessons learned since 2006, Joop Huij, Pim van Vliet, Weili Zhou and Wilma de Groot, Robeco Research Paper, February 2012
3 For an overview of the use of Machine Learning for asset management we refer to: Blitz, D., Hoogteijling, T., Lohre, H., & Messow, P. (2023). How can machine learning advance quantitative asset management? The Journal of Portfolio Management, 49(9), 78-95.
4 A more extensive description of the Machine Learning approach was published in 2021, at the time of introduction in our Quantitative Models, and can be found at: Forecasting stock crash risk with machine learning.

Discover the value of quant

Subscribe for cutting-edge quant strategies and insights.

Explore quant
Robeco

Robeco aims to enable its clients to achieve their financial and sustainability goals by providing superior investment returns and solutions.

Important information
The Robeco Capital Growth Funds have not been registered under the United States Investment Company Act of 1940, as amended, nor or the United States Securities Act of 1933, as amended. None of the shares may be offered or sold, directly or indirectly in the United States or to any U.S. Person (within the meaning of Regulation S promulgated under the Securities Act of 1933, as amended (the “Securities Act”)). Furthermore, Robeco Institutional Asset Management B.V. (Robeco) does not provide investment advisory services, or hold itself out as providing investment advisory services, in the United States or to any U.S. Person (within the meaning of Regulation S promulgated under the Securities Act).
This website is intended for use only by non-U.S. Persons outside of the United States (within the meaning of Regulation S promulgated under the Securities Act who are professional investors, or professional fiduciaries representing such non-U.S. Person investors. By clicking “I Agree” on our website disclaimer and accessing the information on this website, including any subdomain thereof, you are certifying and agreeing to the following: (i) you have read, understood and agree to this disclaimer, (ii) you have informed yourself of any applicable legal restrictions and represent that by accessing the information contained on this website, you are not in violation of, and will not be causing Robeco or any of its affiliated entities or issuers to violate, any applicable laws and, as a result, you are legally authorized to access such information on behalf of yourself and any underlying investment advisory client, (iii) you understand and acknowledge that certain information presented herein relates to securities that have not been registered under the Securities Act, and may be offered or sold only outside the United States and only to, or for the account or benefit of, non-U.S. Persons (within the meaning of Regulation S under the Securities Act), (iv) you are, or are a discretionary investment adviser representing, a non-U.S. Person (within the meaning of Regulation S under the Securities Act) located outside of the United States and (v) you are, or are a discretionary investment adviser representing, a professional non-retail investor.


Access to this website has been limited so that it shall not constitute directed selling efforts (as defined in Regulation S under the Securities Act) in the United States and so that it shall not be deemed to constitute Robeco holding itself out generally to the public in the U.S. as an investment adviser. Nothing contained herein constitutes an offer to sell securities or solicitation of an offer to purchase any securities in any jurisdiction. We reserve the right to deny access to any visitor, including, but not limited to, those visitors with IP addresses residing in the United States. This website has been carefully prepared by Robeco. The information contained in this publication is based upon sources of information believed to be reliable. Robeco is not answerable for the accuracy or completeness of the facts, opinions, expectations and results referred to therein. Whilst every care has been taken in the preparation of this website, we do not accept any responsibility for damage of any kind resulting from incorrect or incomplete information. This website is subject to change without notice. The value of the investments may fluctuate. Past performance is no guarantee of future results. If the currency in which the past performance is displayed differs from the currency of the country in which you reside, then you should be aware that due to exchange rate fluctuations the performance shown may increase or decrease if converted into your local currency. For investment professional use only. Not for use by the general public.